Figure 1.


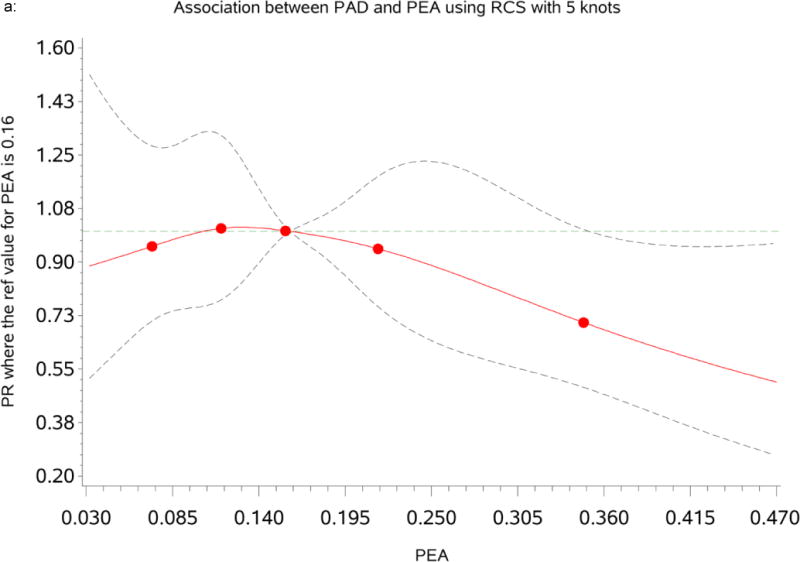
a: Dose-response relationship between percent of European ancestry (PEA) and Peripheral Arterial Disease (PAD). The Prevalence Ratios (PRs) were based on restricted cubic splines at knots of 5th, 35th, 65th and 95th percentiles. The reference was set at the 50th percentile (16%) of the European ancestry distribution. The solid line indicates the PR adjusted for age, sex, traditional CVD risk factors, inflammatory maker, socioeconomic status and psychosocial factors and the dashed lines represents its 95% confidence intervals.
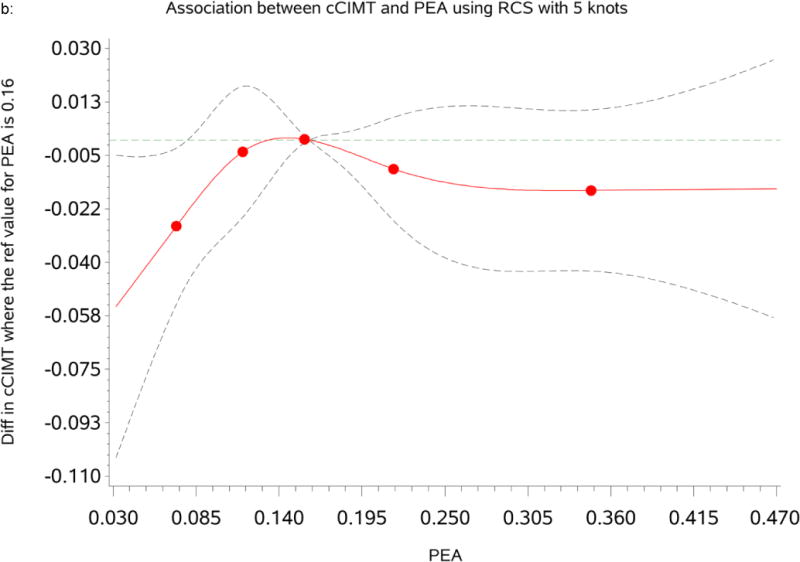
b: Dose-response relationship between percent of European ancestry (PEA) and common Carotid Intima-Media Thickness (cCIMT). The mean differences were based on restricted cubic splines at knots of 5th, 35th, 65th and 95th percentiles. The reference was set at the 50th percentile (16%) of the European ancestry distribution. The solid line indicates the mean difference adjusted for age, sex, traditional CVD risk factors, inflammatory maker, socioeconomic status and psychosocial factors and the dashed lines represents its 95% confidence intervals.
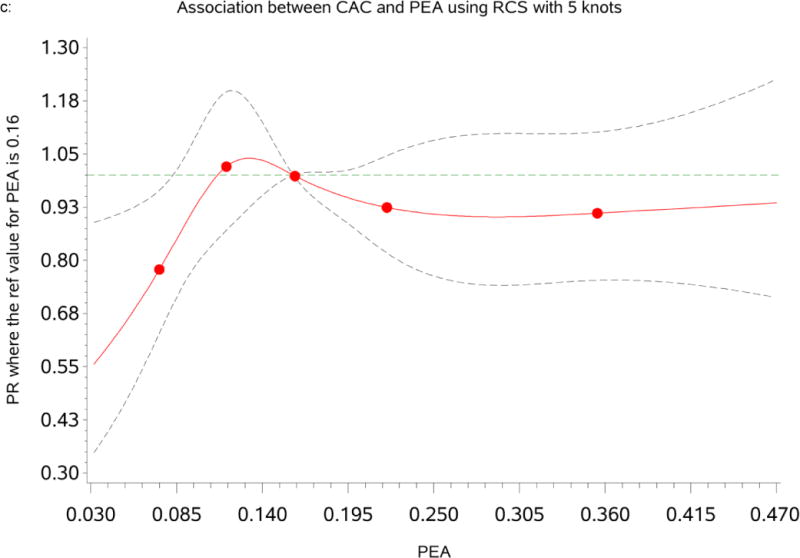
c: Dose-response relationship between percent of European ancestry (PEA) and Coronary Artery Calcium (CAC). The Prevalence Ratios (PRs) were based on restricted cubic splines at knots of 5th, 35th, 65th and 95th percentiles. The reference was set at the 50th percentile (16%) of the European ancestry distribution. The solid line indicates the PR adjusted for age, sex, traditional CVD risk factors, inflammatory maker, socioeconomic status and psychosocial factors and the dashed lines represents its 95% confidence intervals.
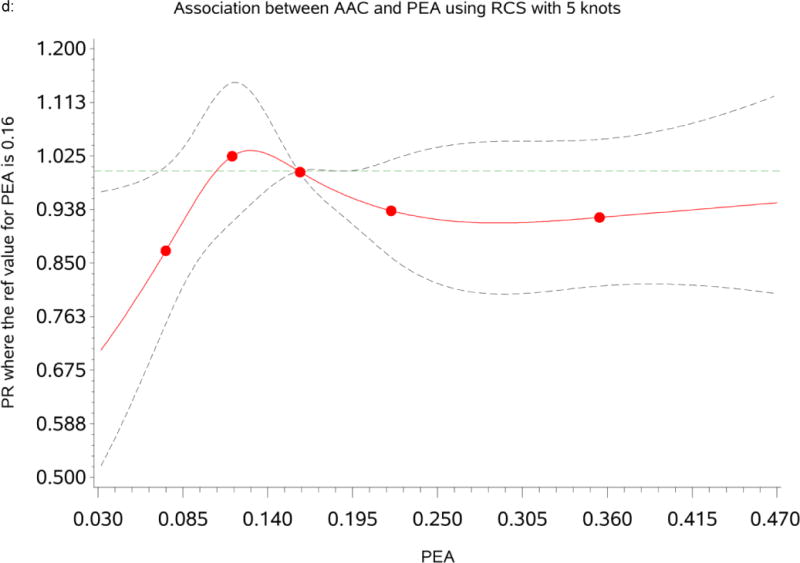
d: Dose-response relationship between percent of European ancestry (PEA) and Abdominal Aortic Calcification (AAC.) The Prevalence Ratios (PRs) were based on restricted cubic splines at knots of 5th, 35th, 65th and 95th percentiles. The reference was set at the 50th percentile (16%) of the European ancestry distribution. The solid line indicates the PR adjusted for age, sex, traditional CVD risk factors, inflammatory maker, socioeconomic status and psychosocial factors and the dashed lines represents its 95% confidence intervals.
