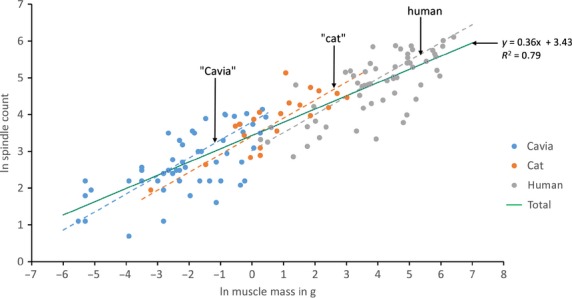
Fig 2.

The relationship of number of spindles and muscle size for muscles from three species of mammal, differing in body size by about an order of magnitude. Scatter plot of logarithmically transformed spindle counts against muscle mass for samples of muscles from guinea pig (Cavia), cat and human. Muscles are only included if they are homologous in at least two species. The least-squares regression of ln (spindle number) vs. ln (muscle mass) for the total sample is shown together with its equation by the continuous line. Dashed lines show the regression relationship for the complete human sample of Fig.1 in its original location (human) and displaced by 3 ln units twice successively along the total regression line (‘cat’ and ‘Cavia’).
