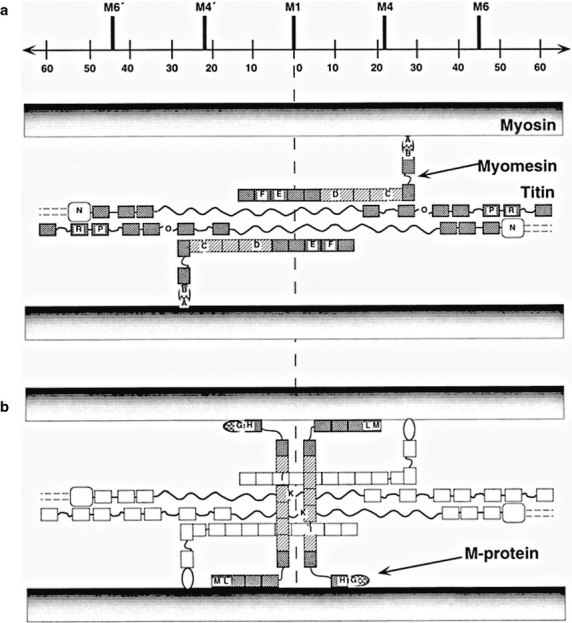
Fig 18.

Schematic presentation of the arrangement of titin, myomesin and M-protein in the M-band compatible with the immunoelectronmicroscopical results (Obermann et al. 1996) At the top of the diagram, the positions of the most prominent M-band striations as defined by Sjostrom & Squire (1977) and a scale bar are indicated. (a) Summarized layout of titin and myomesin deduced from labelling data. Crosshatched and shaded boxes reflect Ig and Fn-domains, respectively. (b) In addition to structures shown in (a), the proposed location of M-protein around the M1-line is highlighted. From Obermann et al. (1996) with permission.
