
Figure 1.
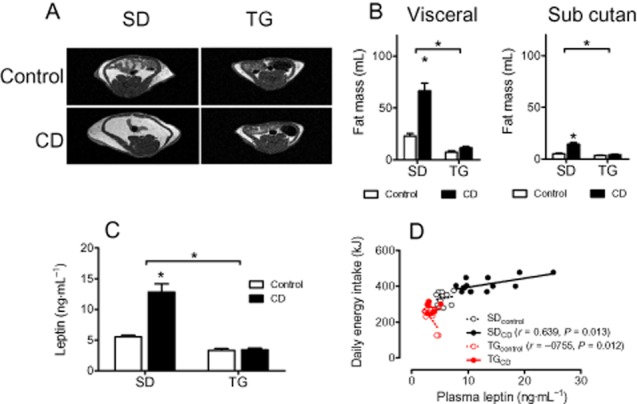
Fat mass and plasma leptin are enhanced by CD feeding in SD, but not in TG rats (protocol 1). (A) Typical MRI images obtained by transverse T1-weighted turbo spin-echo MRI. (B) The abundance of visceral and subcutaneous fat deposits was quantified by computer-assisted planimetry. (C) Plasma levels of leptin at the end of the study; (D) Correlation between plasma leptin and energy intake. Means ± SEM, n = 9–14, *P < 0.05, significantly different from control or as indicated.