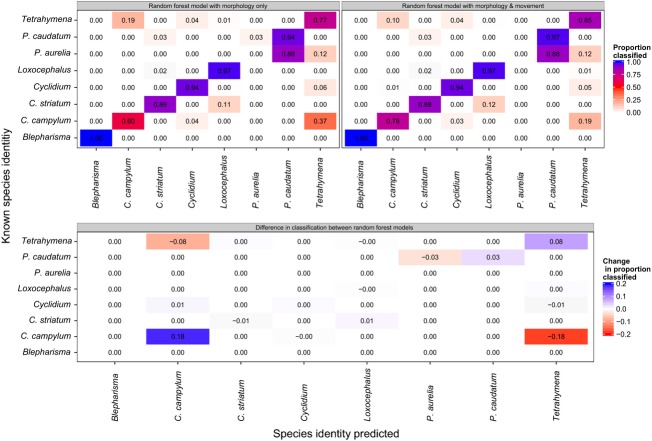
Figure 2.
Confusion matrices between eight ciliate species to illustrate the improved classification success when both morphology and movement features are considered (>89%), compared to morphology only (84%). The lower panel shows the differences in classification success between the two models. Along the diagonal, increases in the proportion of correctly classified species are positive, indicating higher rates of successful classification, whereas off the diagonal, negative differences indicate decreasing classification error (fewer individuals are misclassified into an incorrect species).

