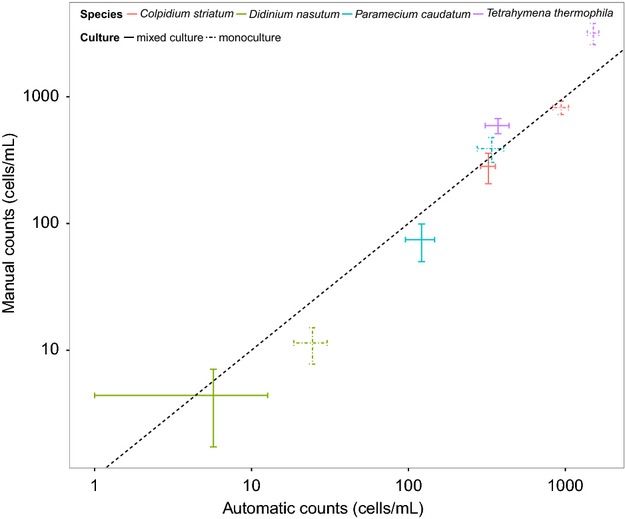
Figure 3.

Comparison of manual and automatic estimates of population abundance in single (dashed bars) and mixed species cultures (solid bars). The ±1 STD error bars are calculated for the 10 repeated samples from each species and cultures (monocultures and mixed cultures) for manual and automatic counts. The dashed line indicates the 1:1 line. A barplot is used instead of showing the data point-by-point because the 10 samples for each treatment were not paired, that is, counting was not made on the same sample but rather on the same experimental unit (the microcosm).
