Figure 4.

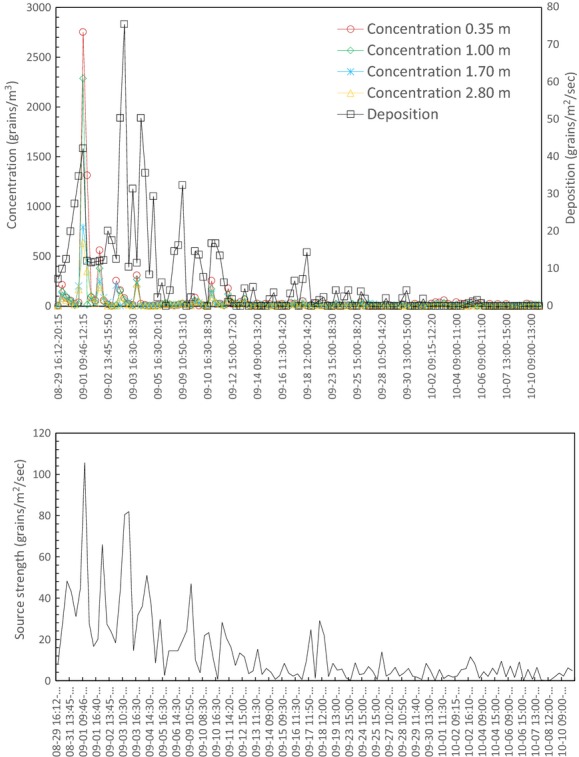
Pollen concentration (at 0.35 m, 1 m, 1.7 m and 2.8 m heights) and deposition at the source center (location of the column of the Rotorod samplers), and pollen source strength during each experimental period.

Pollen concentration (at 0.35 m, 1 m, 1.7 m and 2.8 m heights) and deposition at the source center (location of the column of the Rotorod samplers), and pollen source strength during each experimental period.