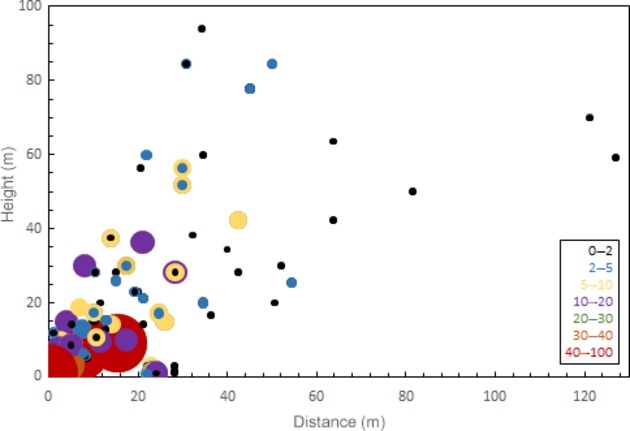
Figure 6.

Pollen concentration (grains/m3) vs downwind distance and height from the location of the column of Rotorod samplers in the field. The points at distance = 0 m at different height are the averages of the data measured at the corresponding height at distance = 0 m during the whole season (showing the averages because the data were too crowded); other data are the data measured during each experimental period. The field edge in the southwest sampling line was at 22 m from the location and the edge in the northeast sampling line was 30 m.
