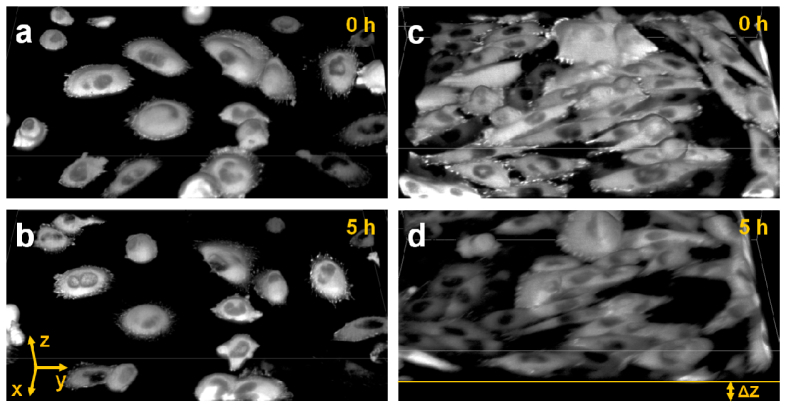
Fig. 5.
3D reconstruction of paxillin-EGFP expressing CHO-K1 cells at the indicated time points with (a,b) and without focus stabilization (c,d), both measured at 37°C. The axial displacement due to sample drift, Δz, is indicated in panel (d). Field of view, 178 × 252 × 32 µm3 (xyz). The images were reconstructed using ImageJ 3D Viewer, voxels were painted with 50% transparency.

