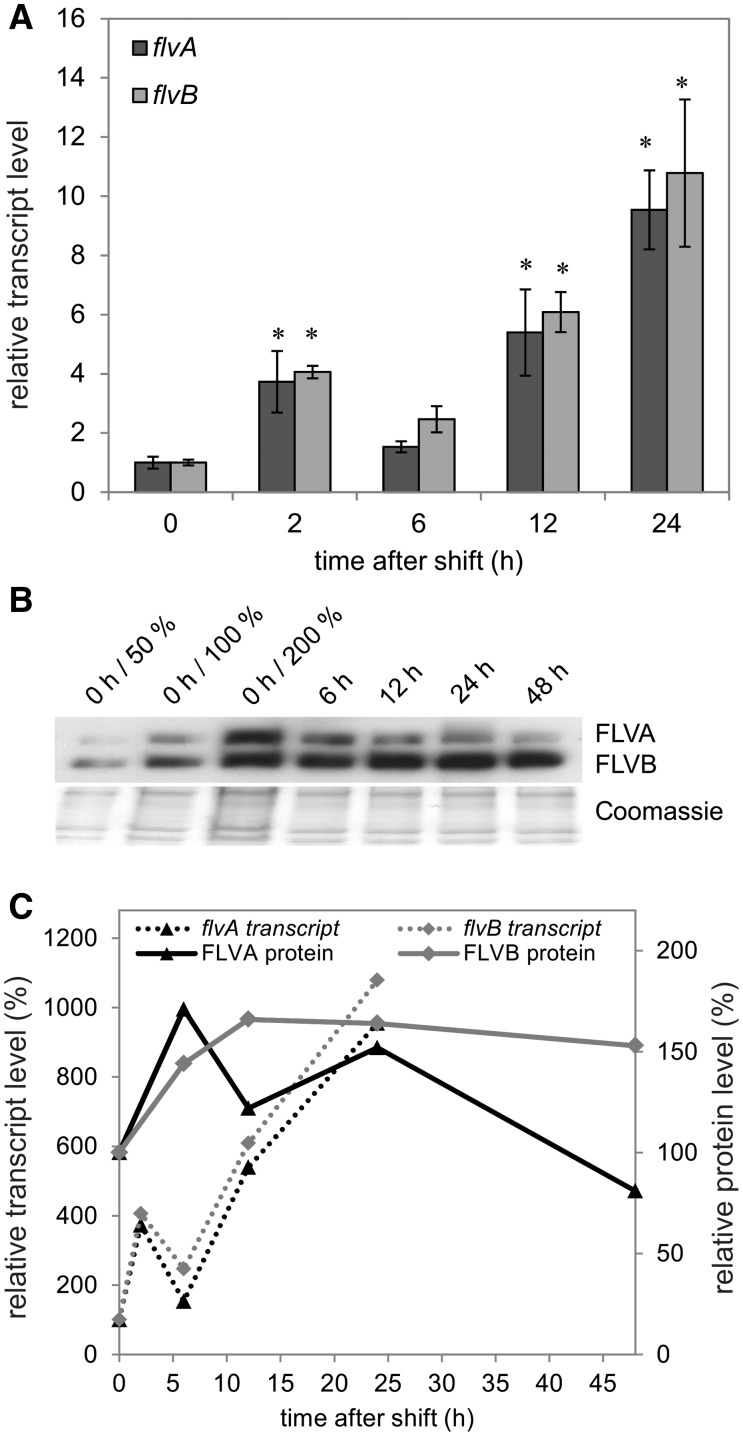
Fig. 3.
Changes in flv transcript (A) and FDP protein (B) levels upon the shift from GLHC to GLLC. RNA was isolated after 0, 2, 6, 12 and 24 h. The values are the mean of three biological replicates (± SD). The significance was evaluated with Student’s t-test (an asterisk represents P ≤ 0.05). The FLVA and FLVB protein accumulation was probed at 0, 6, 12, 24 and 48 h after the shift by a specific antibody. Correlation between transcript (dashed line) and protein (solid line) accumulation level (C). The protein levels were determined by densitometric analysis of three Western blots, performed with Gene Tools (Perkin Elmer).

