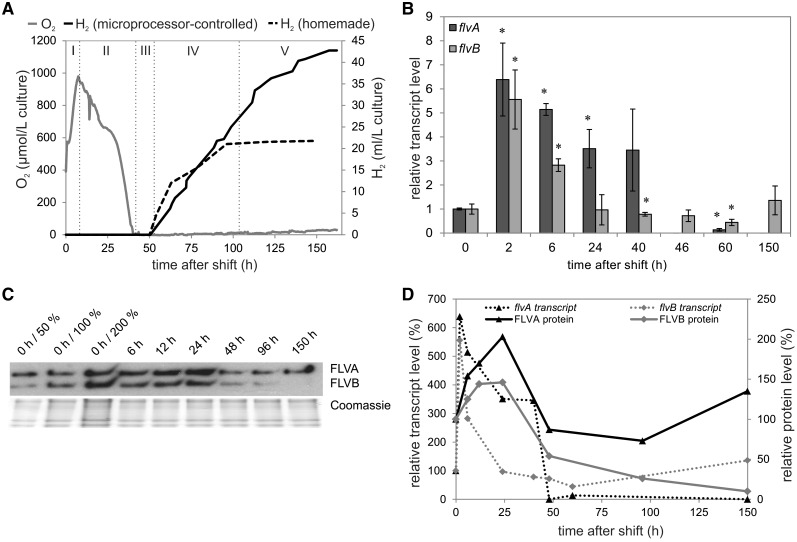
Fig. 6.
Phases during sulfur deprivation in C. reinhardtii cultures in a microprocessor-controlled photobioreactor system (A). H2 photoproduction in C. reinhardtii cultures was induced by transferring the cells at 0 h into TAP-S medium and the produced H2 (full line, microprocessor-controlled photobioreactor system; dashed line, home-made photobioreactor) was gathered by water displacement in the upside-down graduated cylinder filled with water. The O2 level was monitored by the microprocessor-controlled photobioreactor system. The relative transcript levels of flvA and flvB during the shift to H2 photoproduction conditions are shown for 0, 2, 6, 24, 40, 46, 60 and 150 h after the beginning of sulfur deprivation (B). The values are the mean of three biological replicates (± SD) and the significance was evaluated with Student’s t-test (an asterisk represents P ≤ 0.05). The protein levels during H2 photoproduction are shown for 0, 6, 12, 24, 48, 96 and 150 h after the shift to TAP-S medium (C). Correlation between transcript (dashed line) and protein (solid line) accumulation level (D). The protein levels were determined by densitometric analysis of three Western blots, performed with Gene Tools (Perkin Elmer).

