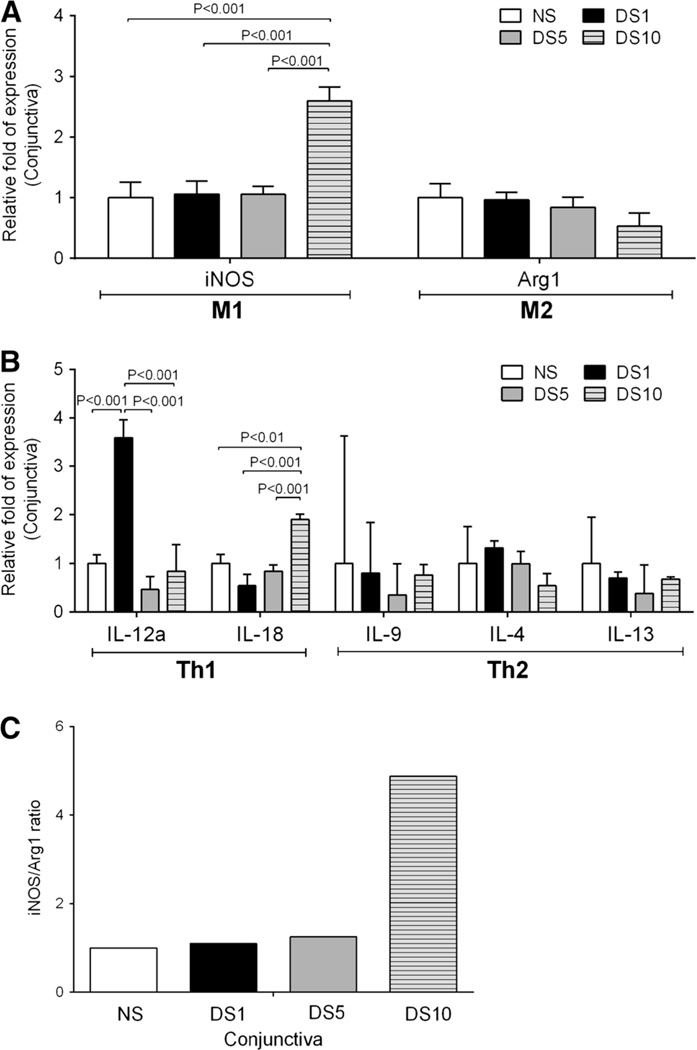
Fig. 2.
Quantitative gene analysis of mRNA transcripts in the conjunctiva of C57BL/6 mice after desiccation stress. a Relative fold of expression of M1 and M2 macrophage markers in conjunctiva of C57BL/6 mice at desiccating stress 1, 5, and 10 days. Bar graphs show mean ° SEM of one representative experiment with 7–10 samples/time point (experiment was repeated twice with similar results). One sample consisted of pooled right and left conjunctivas of the same animal. b Relative fold of expression of T cell-related cytokines and inflammatory cytokines. c iNOS to Arg1 ratio in the conjunctiva of C57BL/6 mice after desiccation stress. NS non-stressed, DS1 desiccating stress (DS) day 1, DS5 DS day 5, DS10 DS day 10, iNOS inducible nitric oxide synthase (NOS2), Arg1 arginase 1, IL-9 interleukin-9

