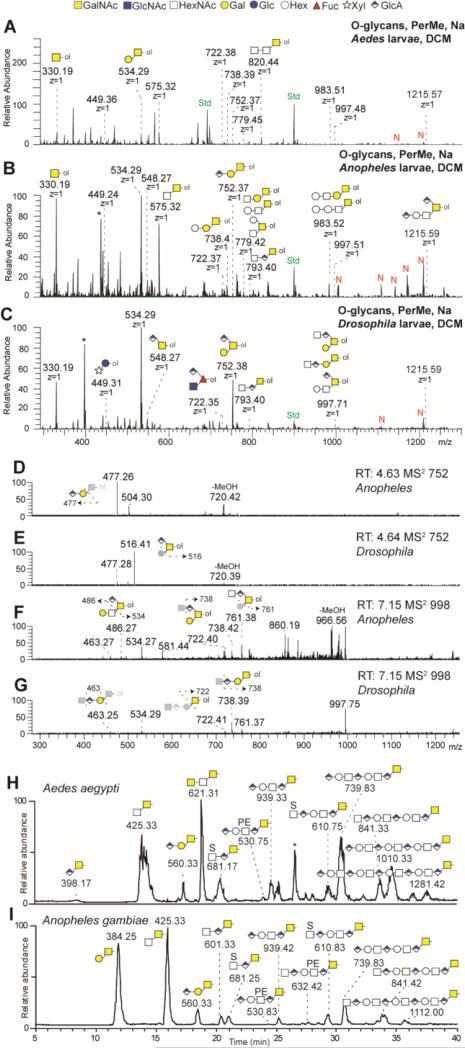
Figure 11. O-glycan analyses by NSI-MS and LC-MS.
O-glycans from Aedes (A), Anopheles (B) and Drosophila (C) larvae were released by reductive β-elimination, permethylated, enriched in the organic (DCM) phase and analysed by NSI-MS in positive ion mode. Singly charged mainly core-1 modified O-glycans were detected. Glucuronylated O-glycans (m/z 752, 998, 1216) were predominantly found in Drosophila larvae. The automated TIM MS2 spectra of the three glucuronylated structures found in Anopheles (D, F) and in Drosophila (E, G) larvae are presenting a mixture of similar daughter ions. Fragmentation schemes are shown in each MS2 spectra. Native, α-eliminated O-glycans from Aedes (H) and Anopheles (I) were also analysed by LC-MS in negative ion mode.

