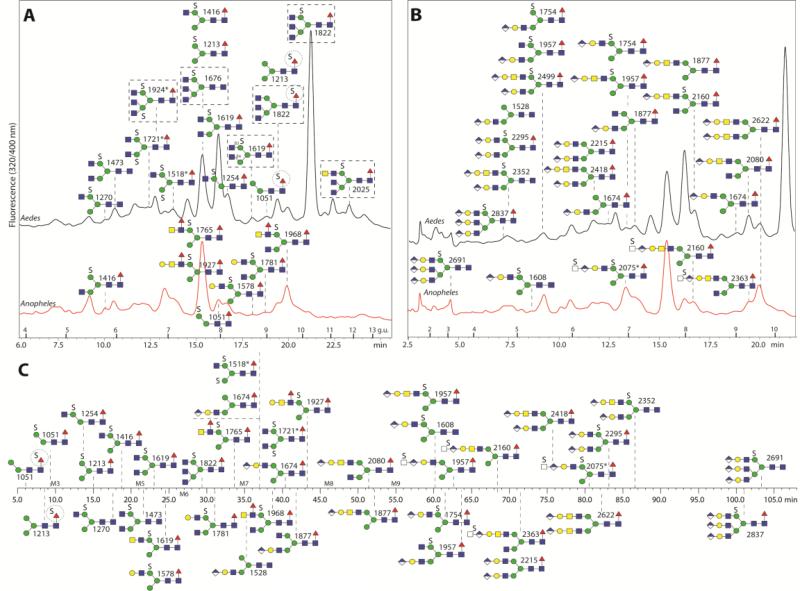
Figure 5. HPLC analysis of anionic N-glycans.
Anopheles and Aedes anionic-enriched N-glycans were chromatographed either on RP-amide (both; respectively red and black chromatograms) or HIAX (Anopheles alone). The same RP-amide chromatograms are annotated with either the sulphated (A) or glucuronylated (B) structures. Glycans above the Aedes chromatogram are found in both species, other than those in boxes which are found in Aedes alone; glycans depicted below the Aedes chromatogram are found solely in Anopheles. The circles highlight putative sulphation of fucose residues. The HIAX schematic chromatogram (C) is shown as a time-scale annotated with selected glycan structures. The triantennary structures in B and C are putative and are based on in-source fragmentation rather than standard MS/MS (see Supplementary Figure 9). In general the higher the number of anionic groups, the earlier the elution is on RP-HPLC and the later on the HIAX column, which also separates according to size; on the other hand, α1,6-fucosylaton is associated with late RP-HPLC retention. Structures are annotated with m/z values from negative ion mode; the disulphated structures marked with an asterisk were detected as [M-2H+Na]− or [M-2H+K]−.

