
Fig. 1.
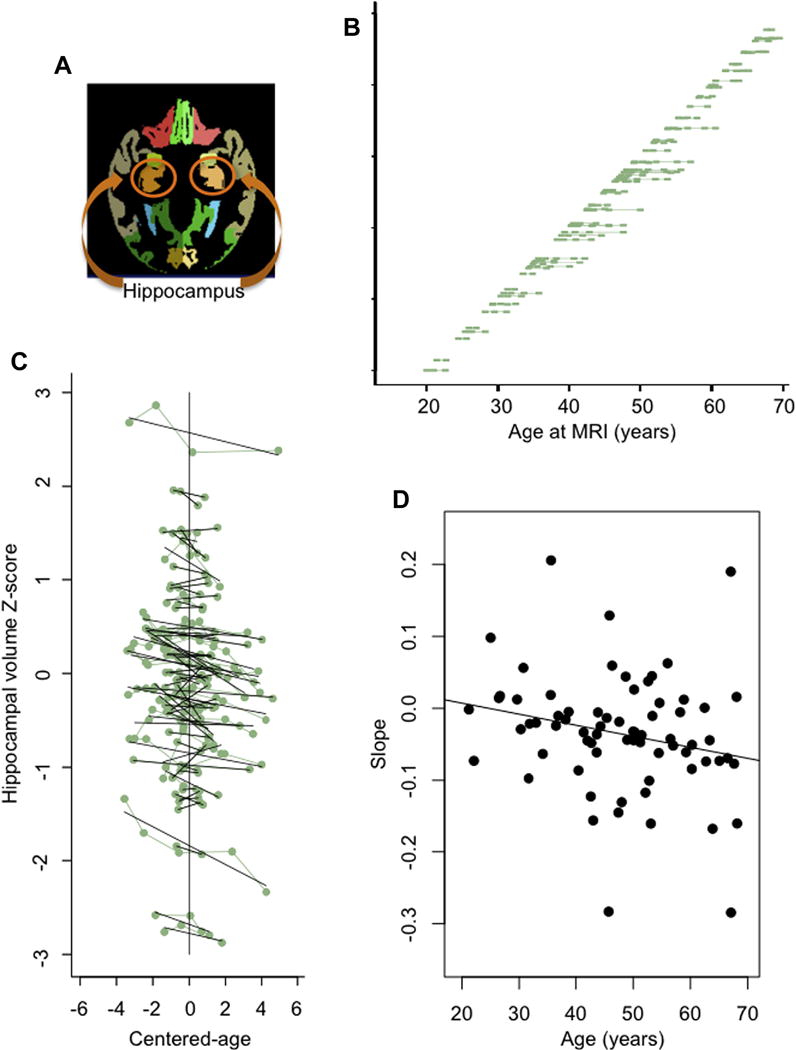
(A) Axial slice of a parcellated MRI structural image displaying a sample of the hippocampus (orange) used to derive the volume, which was measured over multiple slices. (B) Distribution of ages at each MRI (green square) for each participant. (C) Individual hippocampal z-scores (green dots) and slopes (black lines) plotted as a function of centered-age. For example, for a person who was scanned at ages 40, 45, 47, and 52 years, his mean-age = 46 and his centered-age values after subtracting mean-age were −6, −1, +1, and +6 years. (D) Individual hippocampal slopes plotted as function of each individual’s mean age. Abbreviation: MRI, magnetic resonance imaging. (For interpretation of the references to color in this figure legend, the reader is referred to the Web version of this article.)