
Fig. 2.
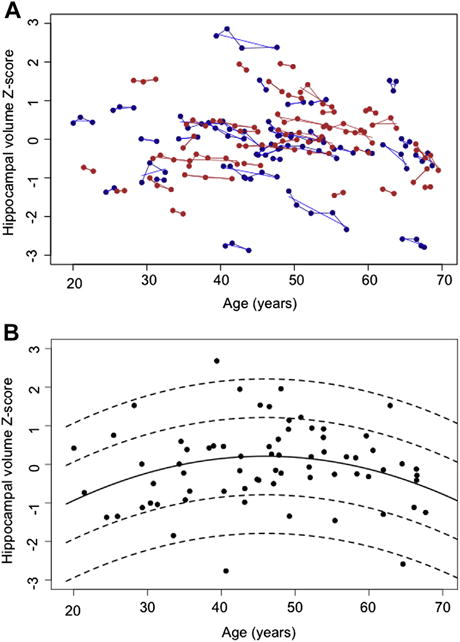
(A) Supratentorial volume-corrected hippocampal z-scores at each magnetic resonance imaging session of the 32 men (blue) and 38 women (red) as a function of chronological age. The blue and red lines are individual’s volume slopes. (B) Scatterplot of hippocampal volume data without trajectory information for first observations only. The solid line is the volume by age quadratic regression function, and the dashed lines are ±1 and 2 standard deviations. (For interpretation of the references to color in this figure legend, the reader is referred to the Web version of this article.)