
Figure 4.
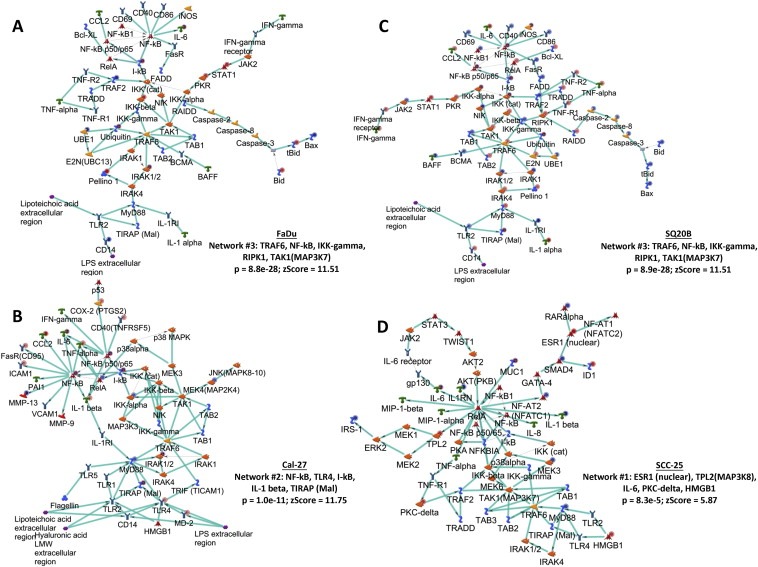
Network analyses of erlotinib‐resistant HNSCC cells. Shown are the top upregulated pro‐inflammatory networks from differentially regulated transcripts comparing microarray data from erlotinib‐resistant FaDu, Cal‐27, SCC‐25 and SQ20B HNSCC cells versus their respective erlotinib‐sensitive cells. Upregulated genes are marked with red circles; downregulated with blue circles. The 'checkerboard' color indicates mixed expression for the gene between cell lines.