
Figure 7.
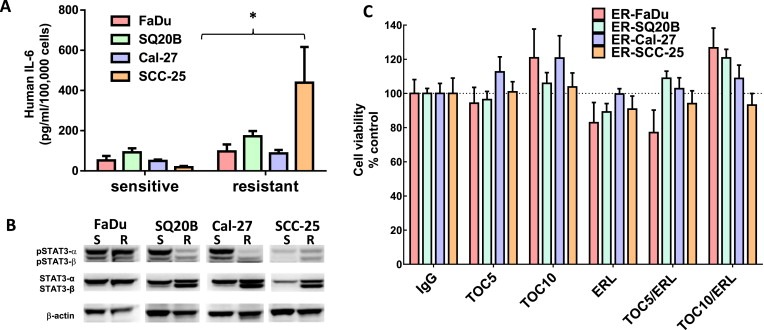
Role of IL‐6 in erlotinib resistance. (A) IL‐6 protein secretion in cell culture supernatants was analyzed by ELISA and the concentrations were normalized by cell number. (B) Cell lysates were analyzed for phosphorylated STAT3 (pSTAT3α and pSTAT3β) and total STAT3 (STAT3α and STAT3β) expression by western blot. Beta‐actin (β‐actin) was used as a loading control. (C) Erlotinib‐resistant FaDu, SQ20B, Cal‐27, and SCC‐25 cells were treated with 5 μM or 10 μM tocilizumab (TOC) in the absence and presence of 5 μM erlotinib (ERL) for 48 h before assessing cell viability. IgG was used as a control. All values were normalized to IgG. Bars represent n = 3 experiments. Error bars represent ± standard error of the mean (SEM). *p < 0.05 versus respective sensitive control.