
Figure 8.
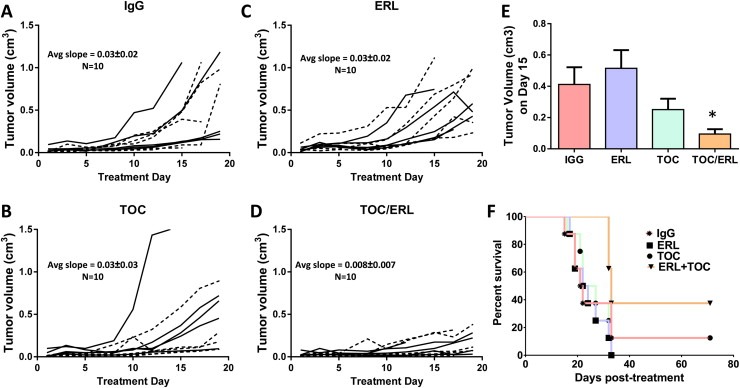
Effect of tocilizumab on erlotinib resistance in vivo. Erlotinib‐resistant SQ20B tumor bearing mice (n = 10 per treatment group) were treated as described in the methods section. Tumor volumes were plotted against treatment day. IgG: immunoglobulin G (A), TOC: tocilizumab (B), ERL: erlotinib (C), TOC/ERL: tocilizumab in combination with erlotinib (D). Solid lines and dashed lines represent male (n = 5) and female (n = 5) mice respectively. Bar graph shows average tumor volumes for each treatment group at treatment day 15 (E). Error bars represent ± standard error of the mean (SEM). *p < 0.05. (F) Kaplan–Meier plot of survival data.