
Figure 2.
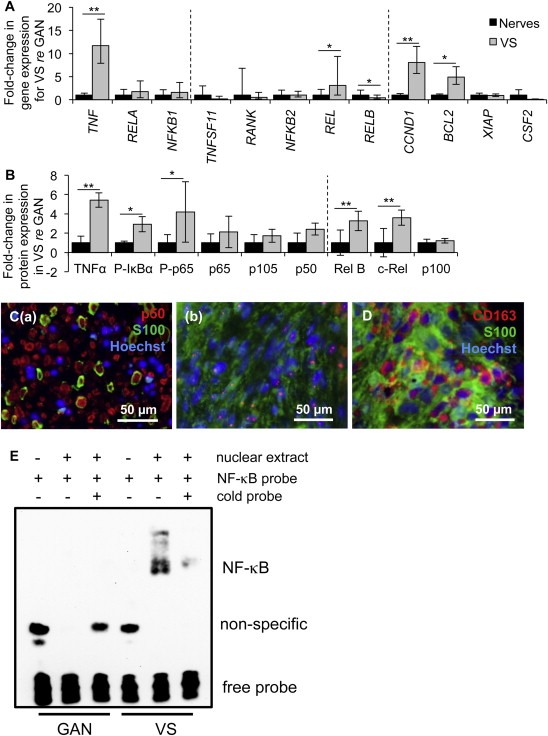
NF‐κB is aberrantly activated in VS. A. NF‐κB pathway expression in human VSs (n ≥ 9 tumors) versus GANs (n ≥ 8 nerves) as measured through qPCR. Dashed lines separate genes by groups, being genes associated with canonical NF‐κB pathway, non‐canonical NF‐κB pathway and downstream targets of NF‐κB. Error bars represent range. B. NF‐κB pathway expression in human VSs (n ≥ 4) versus GANs (n ≥ 4) as quantified through western blot analysis. P‐means phosphorylated protein. Dashed line separates canonical and non‐canonical proteins. Error bars represent SD. C. Representative images of p50 expression (red), as visualized through immunohistochemistry, in (a) VS and (b) GAN specimens. Schwann or schwannoma cells are labeled with S100 (green). D. Representative image of CD163 expression (red), schwannoma cells (S100, green). GAN and VS expression is shown in black and gray bars, respectively (A, B). *p < 0.05, **p < 0.01. Nuclei are labeled with Hoechst (blue) in (C, D). E. Gel shift results show interaction between nuclear extracts of GAN tissue (pooled from 6 different patients, lanes 2–3) or VS tissue (pooled from 4 different patients, lanes 5–6) with the NF‐κB binding site. The interaction could be disrupted in VS nuclear extracts by adding excessive unlabeled NF‐κB binding site (lane 6).