
Table 2. Compared of the physique change, liver weight and energy intake in MF, HF, HS and HFr diets.
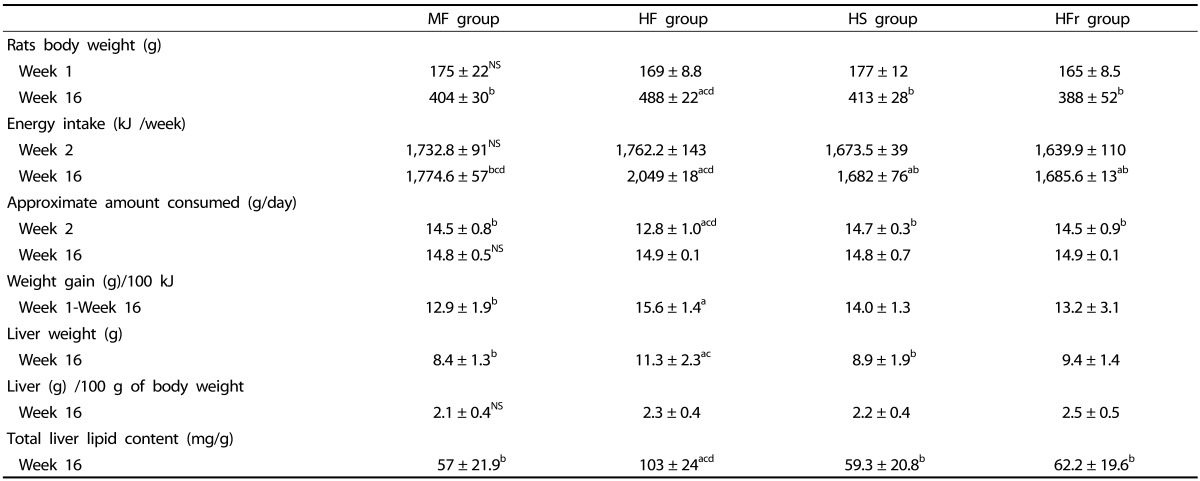
Data are means ± SD, n = 10 rats/group.
NS, not significant. MF, Moderate-fat; HF, High-fat; HS, High-sucrose; HFr, High-fructose.
"a,b,c,d," refer to differences between groups (P < 0.05). Small "a" refers to the MF group, small "b" refers to the HF group, small "c" refers to the HS group, small "d" refers to the HFr group. The Kruskal-Wallis test for non-parametric data or one-way Anova between-groups over week 1 and week 16 for normally distributed data was also performed followed by the Bonferroni multiple comparisons test.