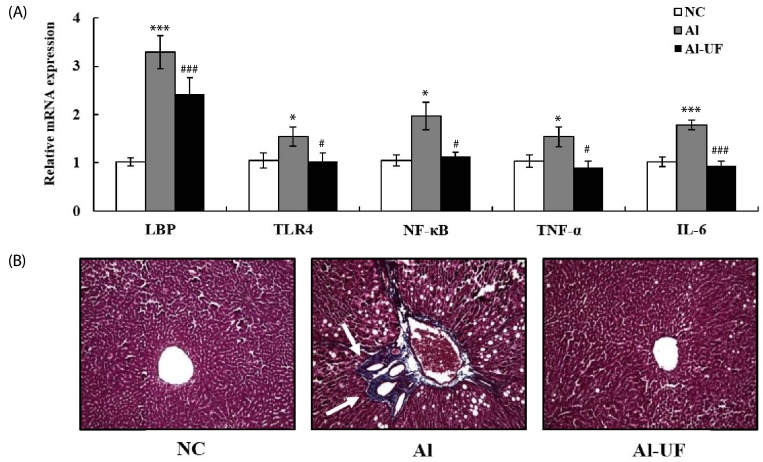
Fig. 3. Effects of umbelliferone on hepatic inflammatory genes expression (A) and Masson's trichrome stain (B) in chronic alcohol-fed rats.
Values are expressed as the means ± SE. Values are significantly different between groups according to Student's t-test. * P < 0.05, *** P < 0.001 NC : Al, # P < 0.05, ### P < 0.001 Al : Al-UF. Relative mRNA expression of each gene was normalized to the GAPDH and compared with NC level. White arrows indicate collagen deposition (200× magnification).

