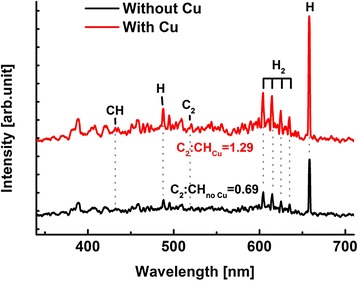
Fig. 7.

Optical emission spectra (OES) during PECVD process with and without copper catalyst. CH peak was matched at 431.4 nm, C2 peak at 516.5 nm, H peaks at 486.1 and 656.3 nm and H2 peaks at 608.3, 618.8, 624.6 and 628.8 nm. The relative intensity of C2:CH is labelled for the cases with and without a Cu foil
