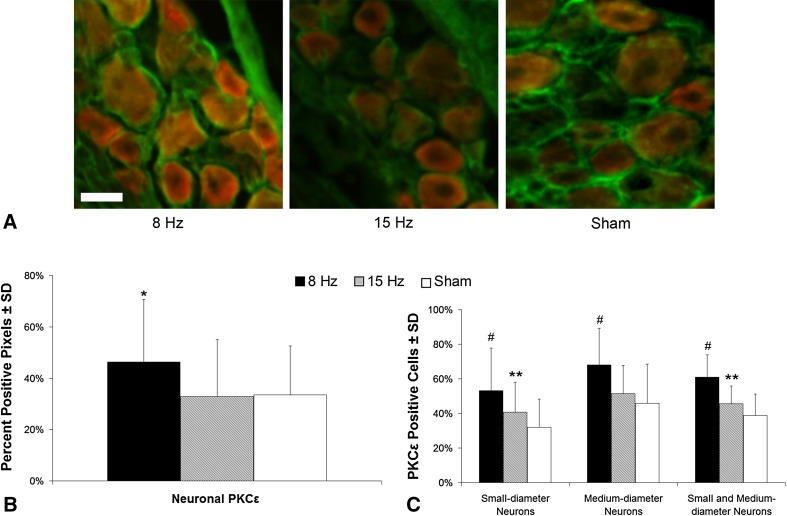
Fig. 4A–C.
Representative images and quantification of PKCε labeling (red) in cervical DRGs colabeled with MAP2 (green), as a neuronal marker, at Day 14. PKCε is increased most robustly after WBV at the painful resonance frequency (8 Hz). Neuronal PKCε (orange) is evident in all groups (A), but more extensively after an 8-Hz vibration, and when quantified, there is more neuronal PKCε (B) evident after an 8-Hz exposure than after a 15-Hz or sham exposure (*p < 0.01). In addition, there are more small- and medium-diameter neurons that are positive for PKCε (C) in the 8-Hz group than in either the sham or 15-Hz groups (#p < 0.01). There are also more PKCε (C) positive small-diameter neurons in the 15-Hz group than the sham group (**p < 0.03). The scale bar in A is 25 µm and applies to all panels.

