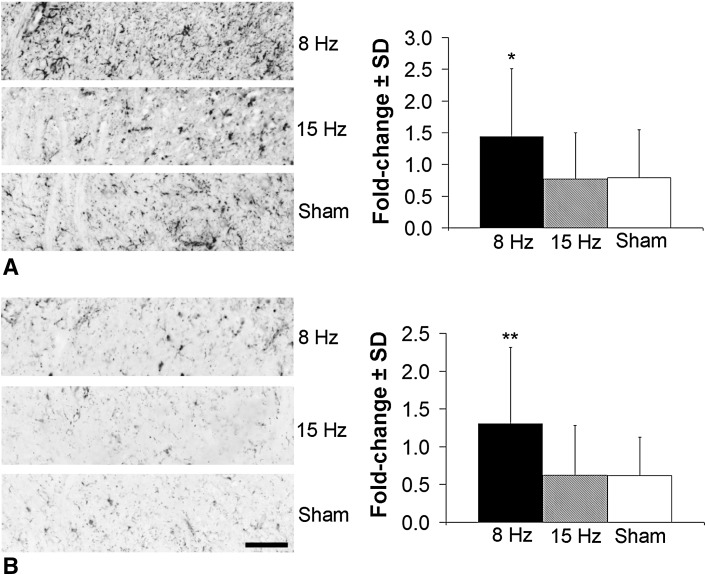
Fig. 6A–B.
Glial cell activation in the superficial spinal dorsal horn at Day 14 increases only after WBV at the resonance frequency (8 Hz). Representative images show increased GFAP immunoreactivity (A), indicative of activated astrocytes, and quantification for each group expressed as fold change over normal at Day 14. There is more GFAP labeling in the 8-Hz group than in either the 15-Hz or sham groups (*p < 0.01). The same is observed with Iba1 immunoreactivity (B), which is greater in the 8-Hz group than in each of the 15-Hz and sham groups (**p < 0.01). The scale bar in (B) is 100 µm and applies to all panels in both A and B.

