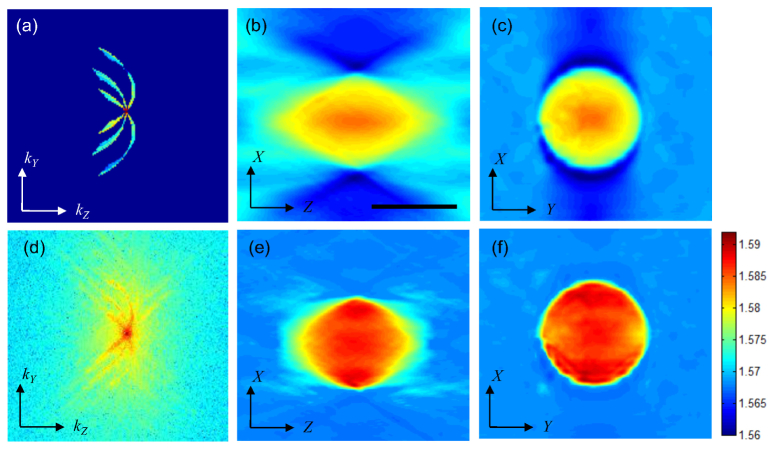
Fig. 5.
Spatial-frequency mapping and reconstructed tomogram of a 10 μm Polystyrene bead before/after regularization. (a) Vertical cross-section of the spatial-frequency spectrum before regularization. (b), (c) Reconstructed images in X-Z and X-Y planes, respectively, before regularization. (d) Vertical cross-section of the spatial-frequency spectrum after regularization. (e), (f) Reconstructed images of the bead in X-Z and X-Y planes after regularization. Scale bar is 10 μm.

