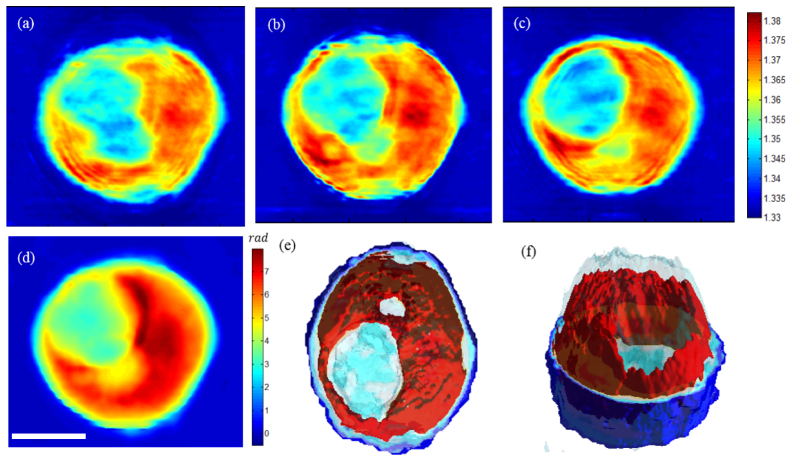
Fig. 6.
Three-dimensional refractive index map of a hematopoietic stem cell: (a)-(c) Horizontal cross-sections of the tomogram at 2 μm intervals. d) Cumulative phase map of the whole cell. (e)-(f) Three-dimensional rendering of the cell using the measured refractive index map, which shows various internal structures. Scale bar is 10 μm.

