Figure 1.
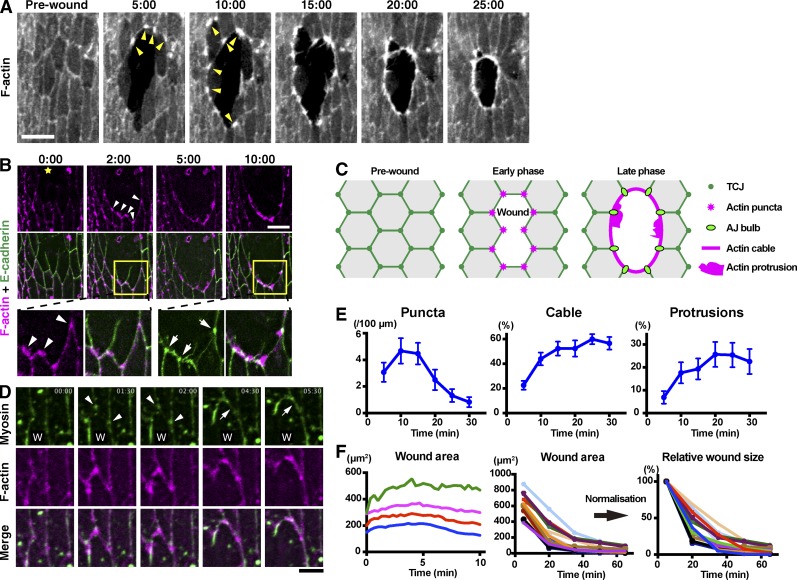
Dynamics of F-actin, E-cadherin, and Myosin at wound edges. (A) Time course of wound closure in Drosophila embryo expressing GFP-Moesin in the epidermis. Arrowheads indicate representative wound edge actin puncta. (B) The epidermis of a Drosophila embryo expressing the F-actin probe mCherry-Moesin (magenta) and E-cadherin–GFP (green) was wounded at the position marked by a yellow star and subjected to time-lapse live imaging. Bottom images show enlarged and enhanced images of the areas indicated by yellow squares in middle images. Arrowheads indicate actin puncta appearing at former-TCJs. Arrows indicate pronounced accumulations of E-cadherin where neighboring cells abut one another at the wound edge. (C) Cartoon illustrating the relationship between actin assembly and cell–cell junctions during wound healing. (D) Wound healing in an embryo expressing GFP-Zipper and mCherry-Moesin. W indicates position of wound. Arrowheads indicate myosin accumulations appearing and then enlarging at former-TCJs along the wound edge. Arrows indicate the formation of a link between two neighboring myosin accumulations. See also Video 1. (E) Wound closure was live imaged in embryos expressing GFP-Moesin and the prevalence of actin puncta, cable, and protrusions throughout the process was quantified as described in Materials and methods (graphs show means ± SEM; n = 10–15 embryos). (F) GFP-Moesin–expressing embryos were wounded, and wound area throughout closure was measured. (left) Wound area in first 10 min after wounding plotted against time at 20-s intervals. Data from four individual embryos are shown. The wounds expanded until ∼5 min and then began to reduce in area. (middle) Wound area throughout closure for 15 individual wounds of varying size measured at 15-min intervals until 65 min after wounding. Note that the wounds all close over a broadly consistent time course and with similar dynamics. (right) Data in middle graph were normalized against the area at 5 min. Time points indicate time after wounding (minutes and seconds) in A, B, and D. Bars: (A and B) 10 µm; (D) 5 µm.

