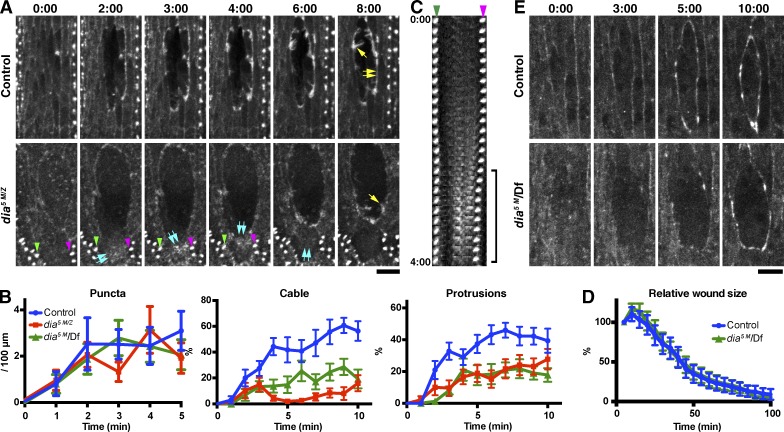
Figure 3.
Dia function in actin remodeling at wound edges. (A) Time-lapse imaging of GFP-Moesin expressed in a control or dia5 M/Z embryo. Yellow single arrows indicate actin protrusions; yellow double arrows indicate actin cable. Blue double arrows in the dia5 M/Z images indicate diffuse assemblies of F-actin within a wound edge cell, which appear at 2 min, move upwards in the cell until 4 min and disappear by 6 min. See also Video 3. The denticles indicated by the green and magenta arrowheads in the dia5 M/Z images are visible in the kymograph in C. (B) Quantitation of wound edge actin puncta, cable, and protrusion levels in control, dia5 M/Z, and dia5 M/Df embryos in the early phase of wound closure. n = 9–13 embryos. (C) Kymograph analysis of the correlation between the formation of diffuse F-actin assemblies and cell contraction. The two denticles indicated by the green and magenta arrowheads in this panel and in A are equivalent. Note that the distance between the two denticles decreases when assemblies of F-actin (equivalent to blue double arrows in A) appear between them (bracket), consistent with this F-actin causing cell contraction. Images taken every 10 s until 4 min after wounding are shown. (D) Quantitation of wound closure in control and dia5 M/Df embryos. Wound areas were normalized to the value at 5 min after wounding and plotted against time. n = 3–13 embryos. (E) Time-lapse imaging of GFP-Spaghetti-squash expressed in a control (+/Df) or dia5 M/Df embryo. Time points indicate time after wounding (minutes and seconds). Graphs show means ± SEM of the data. Bars, 10 µm.

