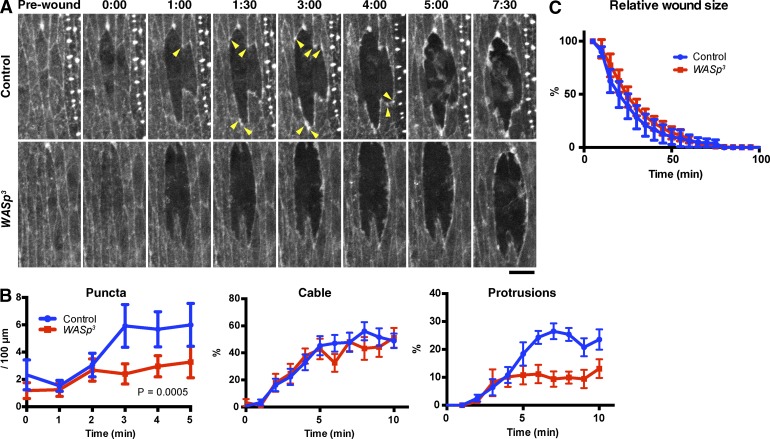
Figure 4.
WASp function in actin remodeling at wound edges. (A) Time-lapse imaging of GFP-Moesin expressed in a control or wasp3 zygotic mutant embryo. Arrowheads indicate actin puncta. Time points indicate time after wounding (minutes and seconds). Bar, 10 µm. (B) Quantitation of wound edge actin puncta (left), cable (middle), and protrusions (right). n = 7–11 embryos. (C) Quantification of wound closure. Wound areas were normalized against the value at 5 min after wounding and plotted against time. n = 6–8 embryos. Graph show means ± SEM of the data.

