Figure 5.
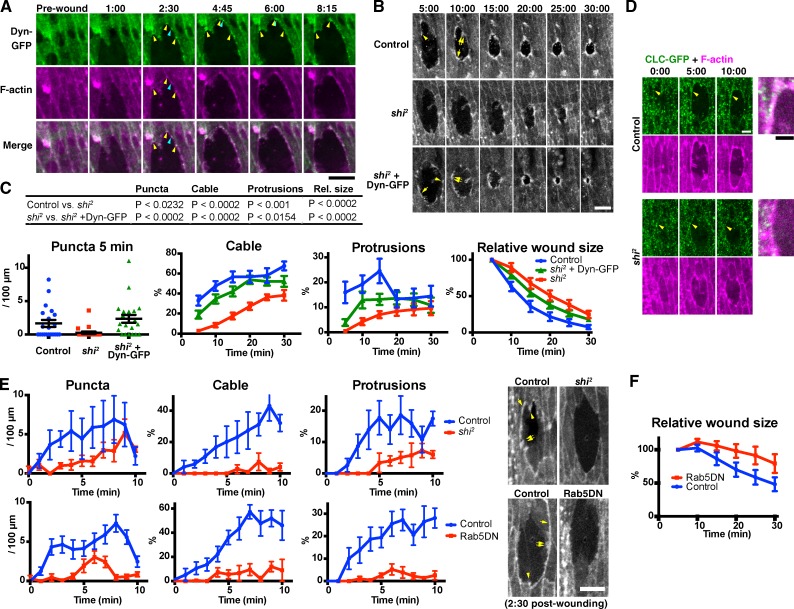
Endocytosis is required for wound edge actin remodeling and wound closure. (A) Time-lapse live imaging of an embryo expressing Dynamin-GFP (Dyn-GFP, green) and mCherry-Moesin (magenta). At 2 min and 30 s, Dynamin-GFP and F-actin colocalize at puncta on the wound edge, at (yellow arrowheads) and also outside (blue arrowheads) former-TCJs. The Dynamin-GFP puncta at former-TCJs were relatively stable and stationary, whereas those at other sites were more transient and mobile. See also Video 4. (B) Time-lapse live imaging of mCherry-Moesin, expressed in control and shi2 embryos (top and middle rows, respectively), and a shi2 embryo expressing Dynamin-GFP (shi2 + Dyn-GFP, bottom row). Representative actin puncta (arrowheads), cables (single arrows), and protrusions (double arrows) are indicated. (C) Quantitation of wound edge actin puncta, cable, protrusions, and wound closure (left to right, respectively) in control embryos, shi2 embryos, and shi2 embryos expressing Dynamin-GFP. Note that puncta were quantified only at 5 min because at later time points, they are obscured by the actin cable and protrusions (see also Fig. 1). n = 12–21 embryos (actin puncta, cable, and protrusions) or 15–16 (wound closure). For the measurement of wound closure, wound area was normalized against the value at 5 min after wounding. The table at the top summarizes the results of statistical analyses of the data. (D) Time-lapse live imaging of a control or shi2 mutant embryo expressing Clathrin light chain-GFP (CLC-GFP; green) and mCherry-Moesin (magenta). Merged images at the right show the wound edge around the arrowheads in the 10:00 images. Note the punctate accumulations of Clathrin-GFP at the wound edge in the control but not in shi2 embryos (arrowheads). (E, top) A more detailed analysis of the formation of actin structures in control or shi2 embryos in the early phase of wound closure. Here, F-actin was visualized using GFP-Moesin. The results confirm the actin remodeling defects observed for shi2 embryos in the longer term analysis in B and C. n = 3–4 embryos. (bottom) Quantitation of actin puncta, cable, and protrusions in control or Rab5DN-expressing embryos. F-actin was visualized using GFP-Moesin. n = 6–8 embryos. Photographs at the right are representative images at 2 min and 30 s after wounding, of the embryos of indicated genotype. See also Videos 5 and 6. (F) Quantitation of wound closure control or Rab5DN-expressing embryos, performed as in C, rightmost graph. n = 10–11. Time points indicate time after wounding (minutes and seconds). Bars, 10 µm. All experiments involving shi2 were performed at 30°C, the restrictive temperature of this mutant. Bars in column scatter plot (C, left) indicate means ± SEM of all plotted values. Line graphs in C, E, and F show means ± SEM of the data.

