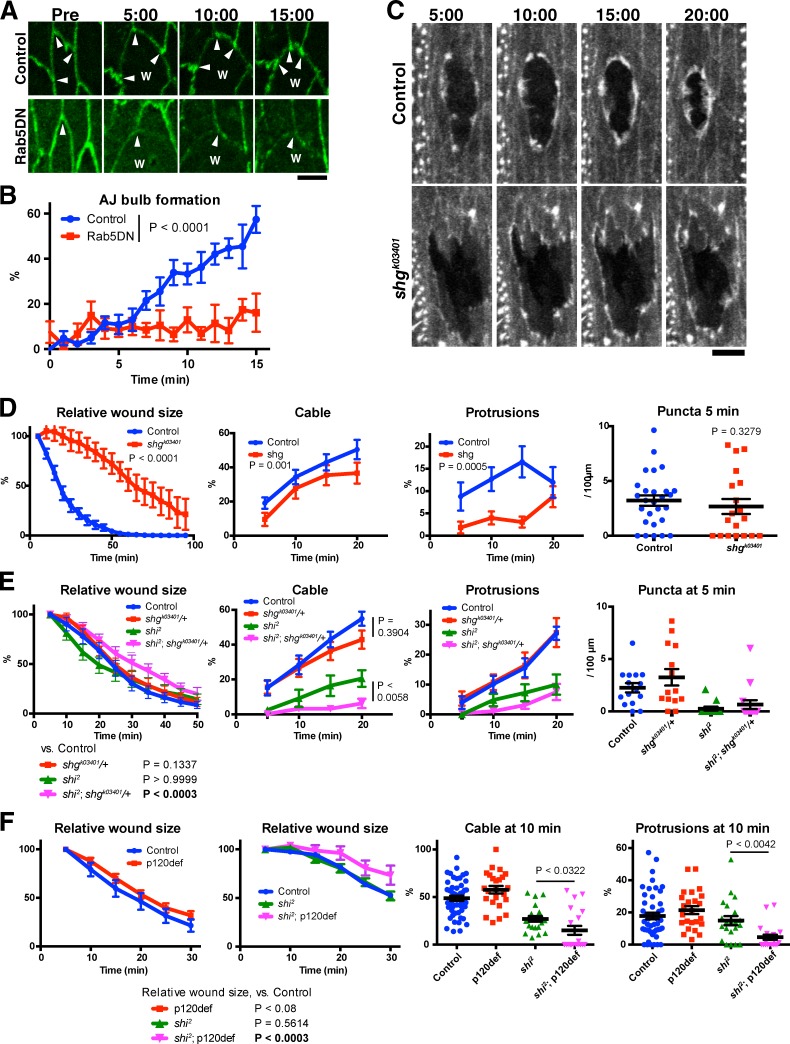
Figure 7.
Genetic interactions between Dynamin and AJ components. (A and B) Effect of Rab5DN on the formation of wound edge AJ bulbs. (A) Representative images of control and Rab5DN-expressing embryos prewounding (Pre) and at the indicated time points after wounding. Note the presence (control) and absence (Rab5DN) of AJ bulbs at wound edge (arrowheads). The images of Rab5DN embryos were enhanced to highlight the shape of wound edge junctions. W indicates position of wound. (B) Quantification of AJ bulb formation over the course of wound healing in control and Rab5DN-expressing embryos, measured as described in Materials and methods. n = 6 or 7 embryos. Each image contained 3–23 wound edge junctions. (C and D) Analysis of the wound healing of zygotic homozygous shg mutant embryos. (C) Representative images of F-actin visualized using GFP-Moesin in embryos with indicated genotype at indicated time points. (D) Normalized wound area and the formation of actin puncta, cable, and protrusions in embryos of the indicated genotypes were quantified and plotted (left to right, respectively). n = 5–27 embryos. (E) Analysis of the effect on wound closure and wound edge actin remodeling of loss of one copy of shg in a wild-type (control) or shi2 background. Normalized wound area and the formation of actin puncta, cable, and protrusions in embryos of the indicated genotypes were quantified and plotted (left to right, respectively). n = 8–22 embryos. (F) Analysis of the effect on wound closure (left two graphs, n = 15–20), and wound edge actin remodeling (right two graphs) of loss of both maternal and zygotic p120ctn (p120def) from wild-type (control) or shi2 embryos. Normalized wound area and the formation of actin cable and protrusions in embryos of the indicated genotypes were quantified and plotted. All experiments were performed at 25°C. Time points indicate time after wounding (minutes and seconds). Bars indicate the means ± SEM of all plotted values. Bars: (A) 5 µm; (C) 10 µm.

