Figure 1.
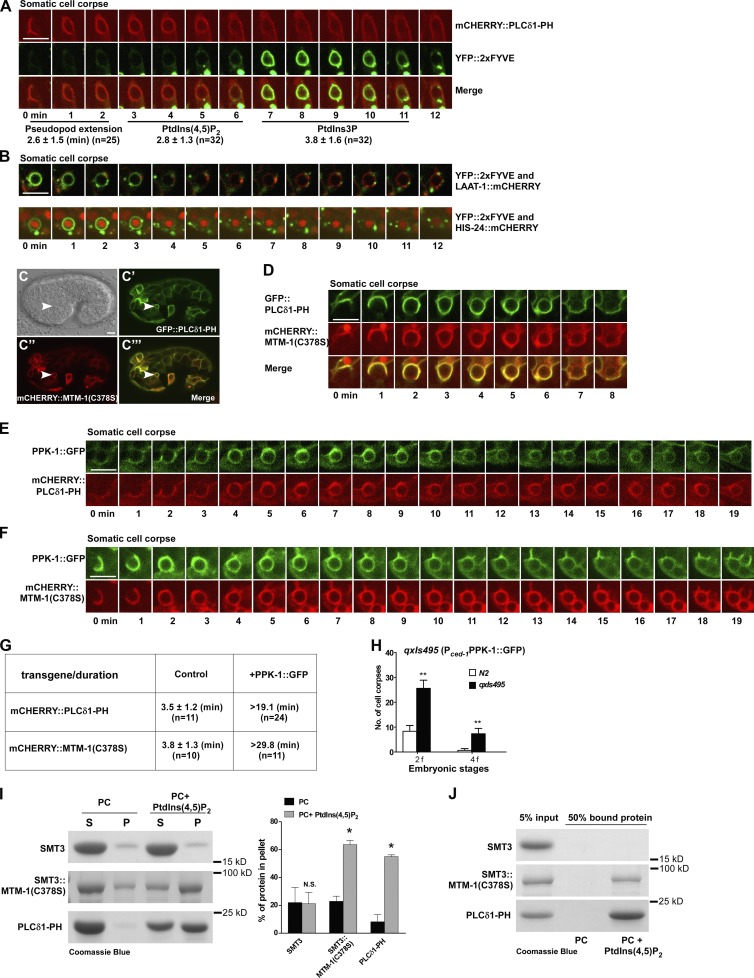
PtdIns(4,5)P2 regulates the phagosomal dynamics of MTM-1. (A) Time-lapse images of a cell corpse in a wild-type embryo expressing mCHERRY::PLCδ1-PH and YFP::2xFYVE. “0 min” represents the time point when PLCδ1-PH was first detected around the cell corpse. The time period until the cell corpse was surrounded by PLCδ1-PH was defined as the pseudopod extension stage. Quantification of the pseudopod extension time and phagosomal duration of PLCδ1-PH and 2xFYVE is shown beneath the images. (B) Time-lapse images of cell corpses in wild-type embryos coexpressing YFP::2xFYVE and LAAT-1::mCHERRY or HIS-24::mCHERRY. “0 min” represents the time point when the 2xFYVE ring appeared. (C–C’’’) DIC and fluorescent images of a wild-type embryo coexpressing GFP::PLCδ1-PH and mCHERRY::MTM-1(C378S). Arrowheads indicate a cell corpse surrounded by both PLCδ1-PH and MTM-1(C378S). (D) Time-lapse images of a cell corpse in a wild-type embryo coexpressing GFP::PLCδ1-PH and mCHERRY::MTM-1(C378S). “0 min” represents the time point when PLCδ1-PH and MTM-1(C378S) were first detected around the cell corpse. (E and F) Time-lapse images of cell corpses in wild-type embryos coexpressing PPK-1::GFP and mCHERRY::PLCδ1-PH (E) or mCHERRY::MTM-1(C378S) (F). “0 min” represents the time point when PPK-1 and PLCδ1-PH (E) or MTM-1(C378S) (F) were first seen around the cell corpse. (G) Quantification of the duration of mCHERRY::PLCδ1-PH and mCHERRY::MTM-1(C378S) on phagosomes with or without PPK-1 expression. (H) Cell corpses were quantified at twofold (2f) and fourfold (4f) embryonic stages in wild type without (N2) or with PPK-1 expression (qxIs495). At least 15 animals were scored in each strain. Data at each embryonic stage were compared with unpaired t tests. **, P < 0.0001. (I) MTM-1(C378S) bound to PC liposomes containing 4% PtdIns(4,5)P2 is more abundant in pellets (P) than in supernatants (S). Three independent experiments were performed. Unpaired t tests were performed. *, P < 0.05. (J) MTM-1(C378S) bound to PC liposomes containing 10% PtdIns(4,5)P2 is recovered in the top fraction in a liposome flotation assay. (A and G) “n” indicates the number of quantified phagosomes. (A, B, and D–F) Images in 20–25 z series were captured. Representative images are shown. Data are shown as mean ± SD. Bars, 5 µm.

