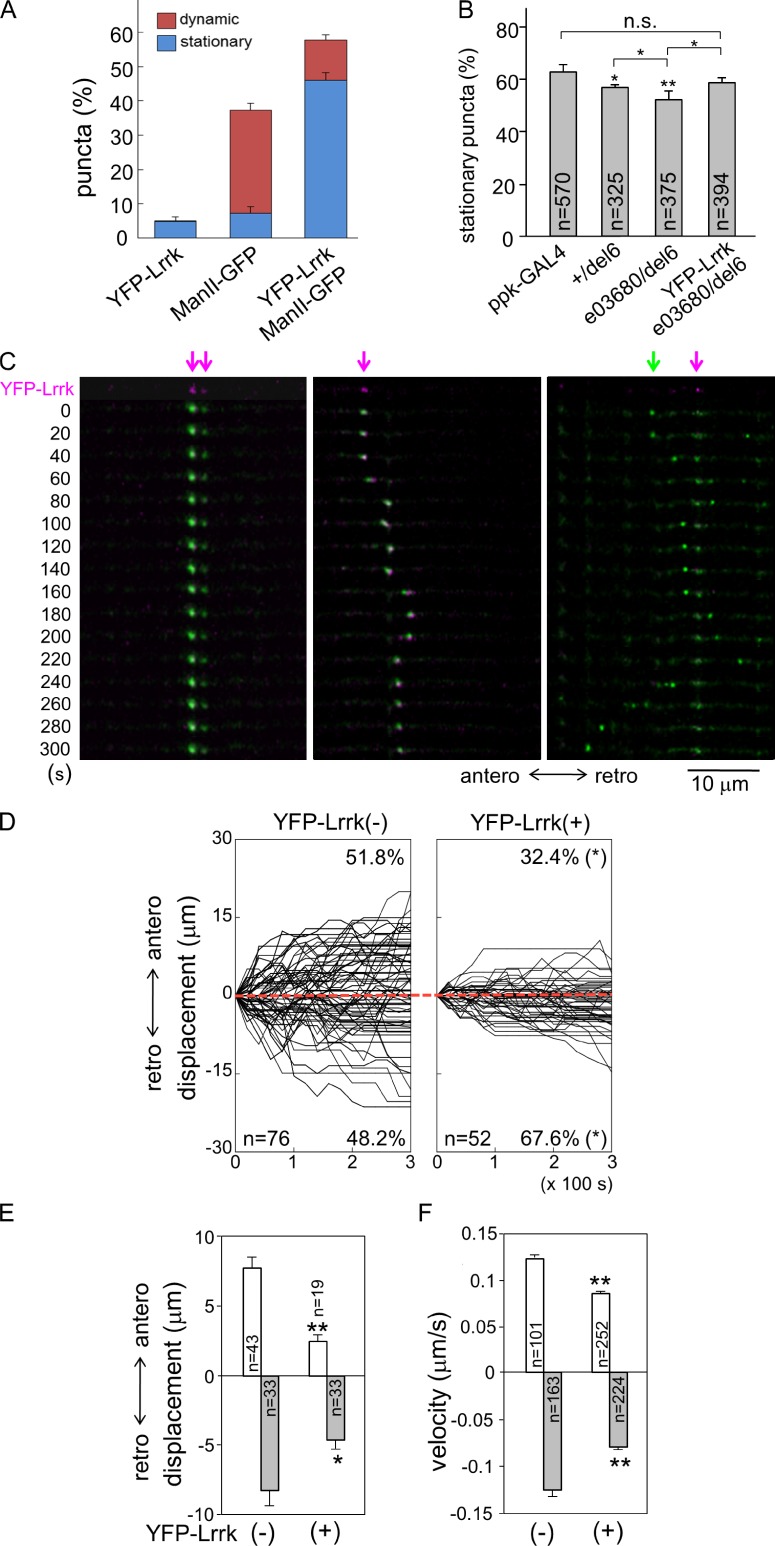
Figure 2.
Lrrk-localized GOPs are stationary. (A) Bar graph shows percentages of three types of puncta in dendrites, YFP-Lrrk positive, ManII-GFP positive, and double positive driven ppk-GAL4, either dynamic (red) or stationary (blue). Mean percentages are from a total 625 puncta of 10 neurons. (B) Bar graph shows percentages of stationary ManII-GFP puncta in genotypes below graph, and statistic significance was compared of ppk-GAL4 control with total sample numbers from more than five neurons indicated in bars. (C) ManII-GFP puncta (green) with colocalized YFP-Lrrk (magenta arrows) are stationary (left and right columns) or move within a short range (middle). ManII-GFP puncta without YFP-Lrrk (green arrow) travel for long distances (right). The first row shows single YFP-Lrrk signal (magenta) and the rest show merged YFP-Lrrk and ManII-GFP (green) signals. Dendrites were labeled by ppk-GAL4-driven mCD8-RFP (not depicted) in third-instar larval stages and straightened for display. Images were taken in 20-s intervals for 5 min. Anterograde (antero) and retrograde (retro) movements are indicated. (D) Tracks of dynamic ManII-GFP puncta without or with YFP-Lrrk colocalization, denoted as YFP-Lrrk(−) and YFP-Lrrk(+), respectively. Punctum numbers and percentages in both directions are indicated within boxes. The x axes represent recording times (seconds) and y axes the displacements of puncta relative to starting points (time 0 and displacement 0). Each track is shown for 5-min recording in 20-s intervals. Anterograde displacement is shown as plus and retrograde as minus. Red dotted lines are aligned along displacement 0. (E and F) Bar graphs show mean anterograde and retrograde displacements (E) and velocities (F) for YFP-Lrrk(−) and YFP-Lrrk(+), with statistic significance compared between two groups. Error bars represent SEM. Statistical comparisons are to controls (unless specifically indicated) by Student’s t test. *, P < 0.05; **, P < 0.001; n.s., no significance.

