Figure 3.
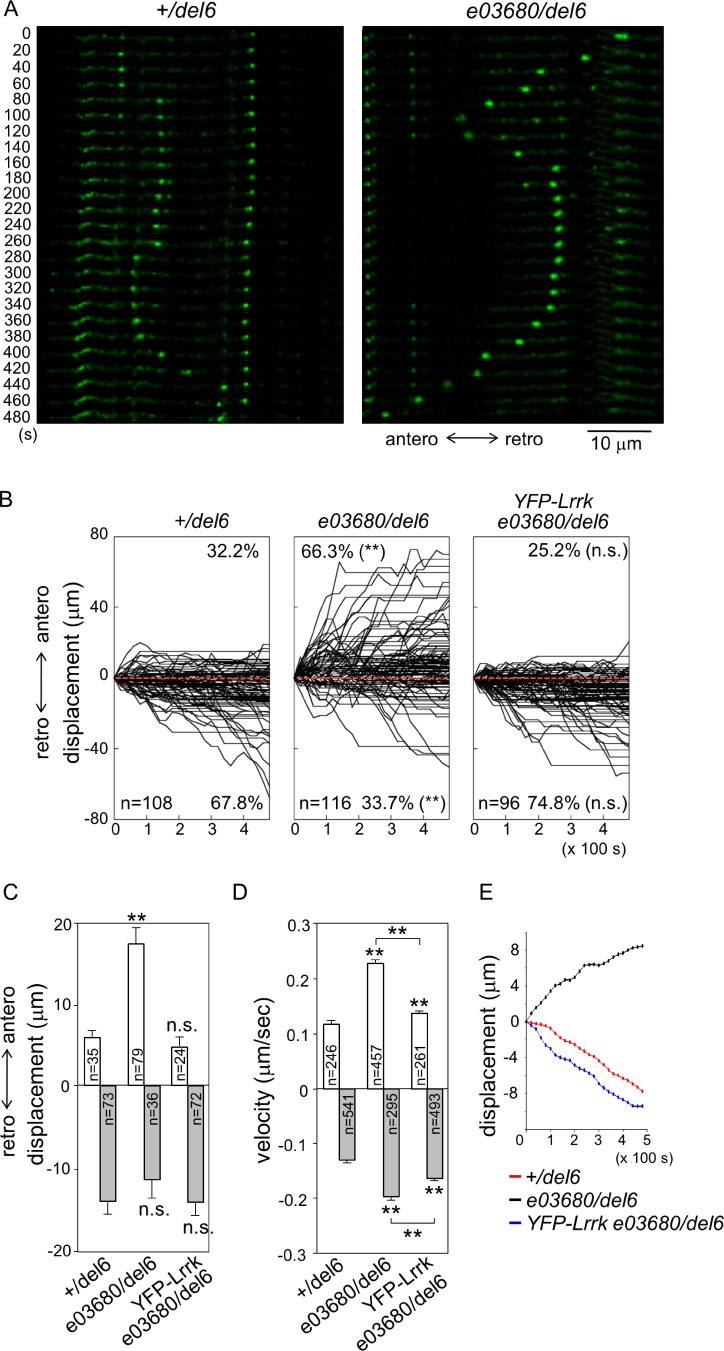
Lrrk suppresses GOP anterograde movement. (A) Movement of ManII-GFP puncta expressed by ppk-GAL4 in +/del6 (left) and e03680/del6 (right). Image series were taken for 8 min in 20-s intervals in dendrites of third-instar larvae and are shown, as done for Fig. 2 C. (B) Combined tracks of ManII-GFP puncta are shown for an 8-min period with 20-s intervals for genotypes shown above each panel. (C and D) Bar graphs show mean displacements (C) and velocities (D) of puncta. Error bars represent SEM. Statistical comparisons are to controls (unless specifically indicated) by Student’s t test. *, P < 0.05; **, P < 0.001; n.s., no significance. (E) Mean paths show average displacements of puncta at every time point for the three genotypes.

