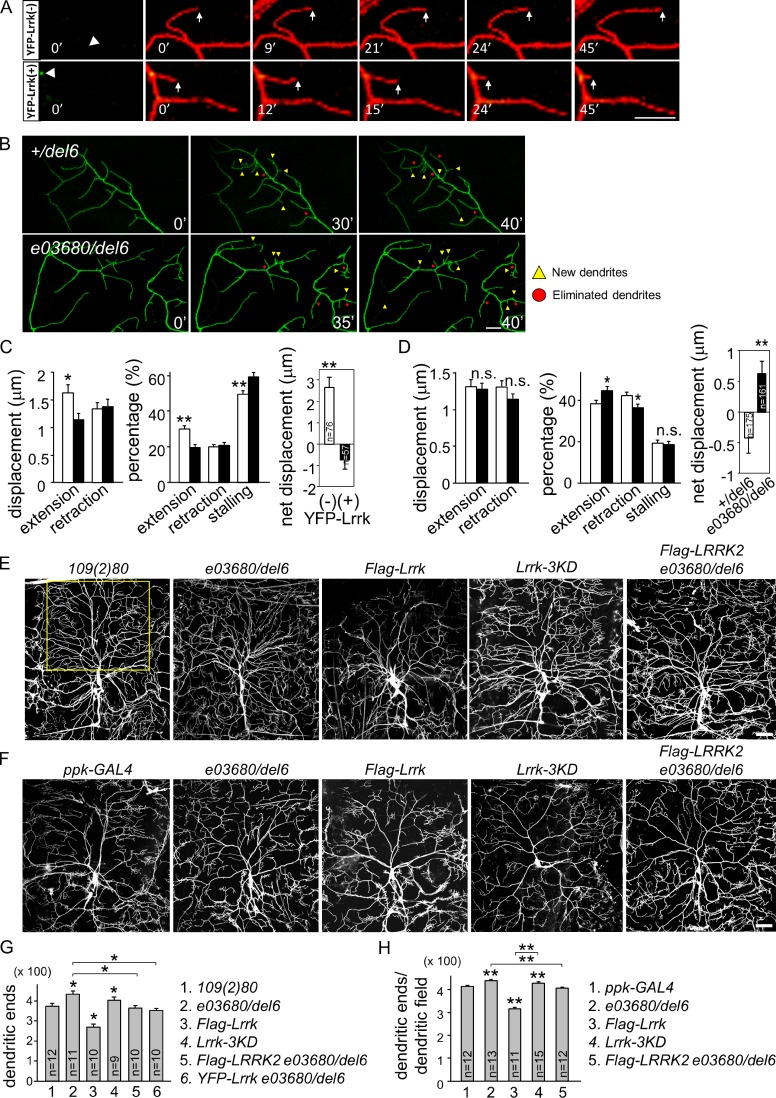
Figure 4.
Lrrk suppresses dendrite development. (A) Time series of images (3-min interval in 45 min) show terminal dendrites labeled by ppk-GAL4-driven mCD8-RFP (red) for YFP-Lrrk(−) and YFP-Lrrk(+) (green). Arrowheads indicate dendritic bases and arrows indicate dynamic terminal dendrites. (B) Images of terminal dendrites labeled by ppk-GAL4-driven mCD8-GFP for +/del6 and e03680/del6 at 0 min, at 40 min, and at an intermediate stage. Yellow triangles, new dendrites; red dots, eliminated dendrites. Bars, 10 µm. (C) Bar graphs show quantifications for dendrite dynamics in A, with YFP-Lrrk(−) as open bars and YFP-Lrrk(+) as shaded bars, with displacements in 3-min intervals in extension (1.63 ± 0.15 and 1.34 ± 0.10 µm, respectively) and retraction (1.14 ± 0.11 and 1.37 ± 0.13 µm); percentages in extension (30.2 ± 1.7 and 19.6 ± 2.4%), retraction (20.2 ± 2.1 and 20.9 ± 2.1%), and stalling (49.6 ± 2.2 and 59.4 ± 2.7%); and net displacements (2.66 ± 0.49 and −0.75 ± 0.43 µm) after 45-min recording. (D) Bar graphs show terminal dendrites of +/del6 (open bar) and e03680/del6 (shaded bar) for displacements in extension (1.32 ± 0.09 and 1.29 ± 0.07 µm) and retraction (1.31 ± 0.08 and 1.16 ± 0.06 µm); percentages in extension (38.3 ± 1.8 and 44.8 ± 1.8%), retraction (42.4 ± 1.7 and 36.6 ± 1.6%), and stalling (19.3 ± 1.5 and 18.6 ± 1.4%); and net displacements (−0.42 ± 0.25 and 0.66 ± 0.21 µm) in 40 min. (E and F) Images of da dendrites labeled by 109(2)80-driven (E) or ppk-GAL4-driven (F) mCD8-GFP with genotypes indicated on top. Bars, 50 µm. (G and H) Bar graph shows mean dendritic ends in the upper part of dorsal fields (outlined by yellow rectangle in E). (G) 109(2)80 (380.6 ± 18.4), e03680/del6 (446.2 ± 19.7), Flag-Lrrk (280.3 ± 17.1), Lrrk-3KD (402.1 ± 19.3), Flag-LRRK2 e03680/del6 (362.1 ± 17.2), and YFP-Lrrk e03680/del6 (342.1 ± 16.8). (H) ppk-GAL4 (413.3 ± 12.2), e03680/del6 (439.5 ± 17.5), Flag-Lrrk (317.5 ± 19.3), Lrrk-3KD (429.9 ± 16.6), and Flag-Lrrk2 e03680/del6 (408.6 ± 15.8). Error bars represent SEM. Statistical comparisons are to controls (unless specifically indicated) by Student’s t test. *, P < 0.05; **, P < 0.001; n.s., no significance.

