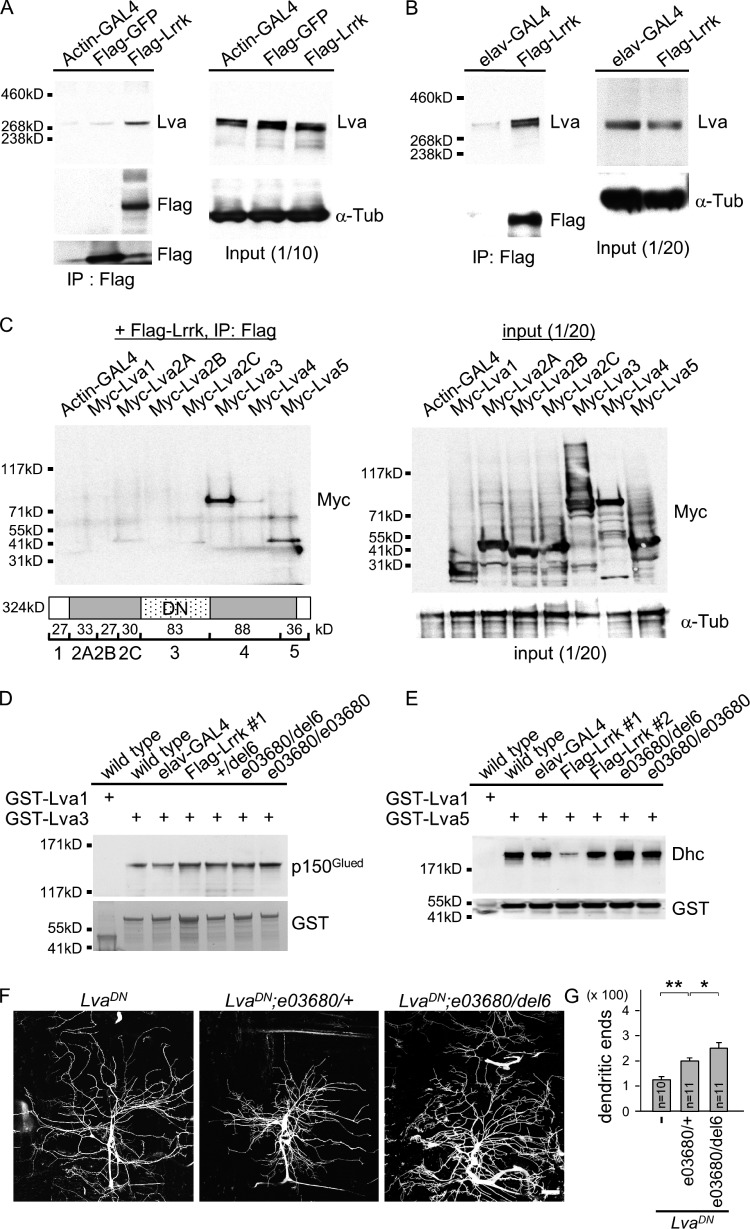
Figure 5.
Lrrk antagonizes the interaction between Lva and Dhc. (A and B) Western blots show coimmunoprecipitated Lva in Flag immunoprecipitates from S2 cells transfected with UAS-Flag-Lrrk or UAS-Flag-GFP driven by Actin-GAL4 (A) or from adult head extracts prepared from elav-GAL4 or elav-GAL4 Flag-Lrrk flies (B). The Flag immunoprecipitates were probed with antibodies for Lva and Flag (left) and input controls with Lva or α-Tub antibodies (right). (C) Western blot by Myc antibodies shows Myc-Lva3 and Myc-Lva5 were detected in Flag immunoprecipitates (left) from S2 cells transfected with Flag-Lrrk and one of Myc-tagged Lva domains (bottom, cartoon). Expressions of Lva domains by Actin-GAL4 were detected by Myc antibodies and input control by α-Tub antibodies (right). Cartoon shows Lva domains and predicted molecular masses; and LvaDN corresponds roughly to Lva3. (D and E) Western blots show pulled-down p150Glued by GST-Lva3 (D) and Dhc by GST-Lva5 (E) in adult brain extracts prepared from wild type (w1118), elav-GAL4 control, Flag-Lrrk overexpression (#1 and #2), +/del6, e03680/del6, and e03680/e03680. Flag-Lrrk #1 is a strong while #2 is a weak expression line. The amounts of GST-Lva3 and GST-Lva5 and negative control GST-Lva1 are shown in bottom panels. Experiments in A–E were repeated three times. (F) Images of da dendrites labeled by 109(2)80-driven mCD8-GFP with genotypes indicated on top. (G) Bar graph shows mean dendritic ends as done for Fig. 4 E for LvaDN (115.2 ± 8.9), LvaDN; e03680/+ (191.5 ± 10.3), and LvaDN; e03680/del6 (223.4 ± 23.1). Error bars represent SEM. Statistical comparisons are to controls (unless specifically indicated) by Student’s t test. *, P < 0.05; **, P < 0.001; n.s., no significance.

