Figure 6.
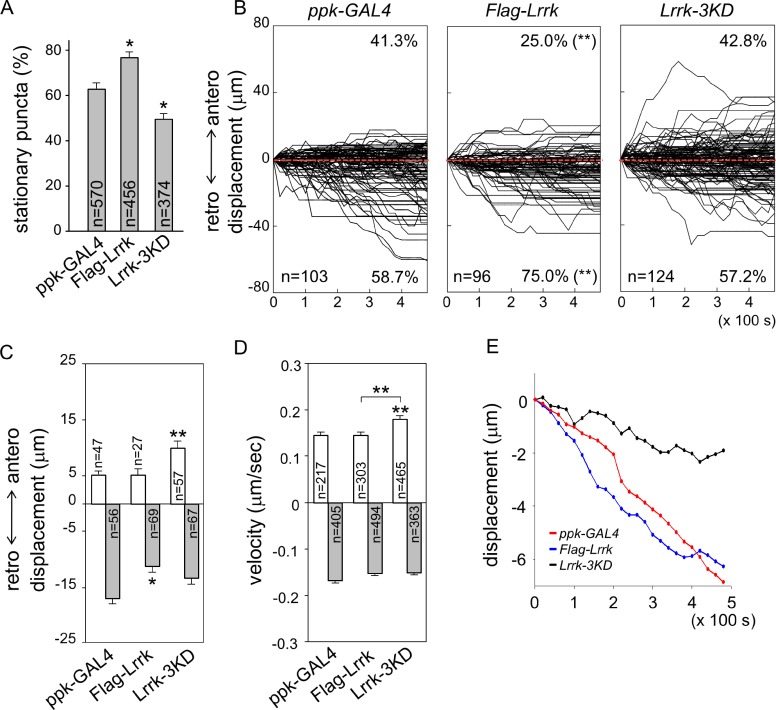
Requirement of kinase activity for Lrrk function. (A) Bar graph shows percentages of stationary ManII-GFP puncta for ppk-GAL4, Flag-Lrrk, and Lrrk-3KD overexpression from more than five neurons. (B) Combined tracks of dynamic ManII-GFP puncta are shown as done for Fig. 3 B. (C and D) Bar graphs show mean anterograde and retrograde displacements after 8-min recording (C) and velocities (D). Error bars represent SEM. Statistical comparisons are to controls (unless specifically indicated) by Student’s t test. *, P < 0.05; **, P < 0.001; n.s., no significance. (E) Mean paths of ManII-GFP movement for the three genotypes.

