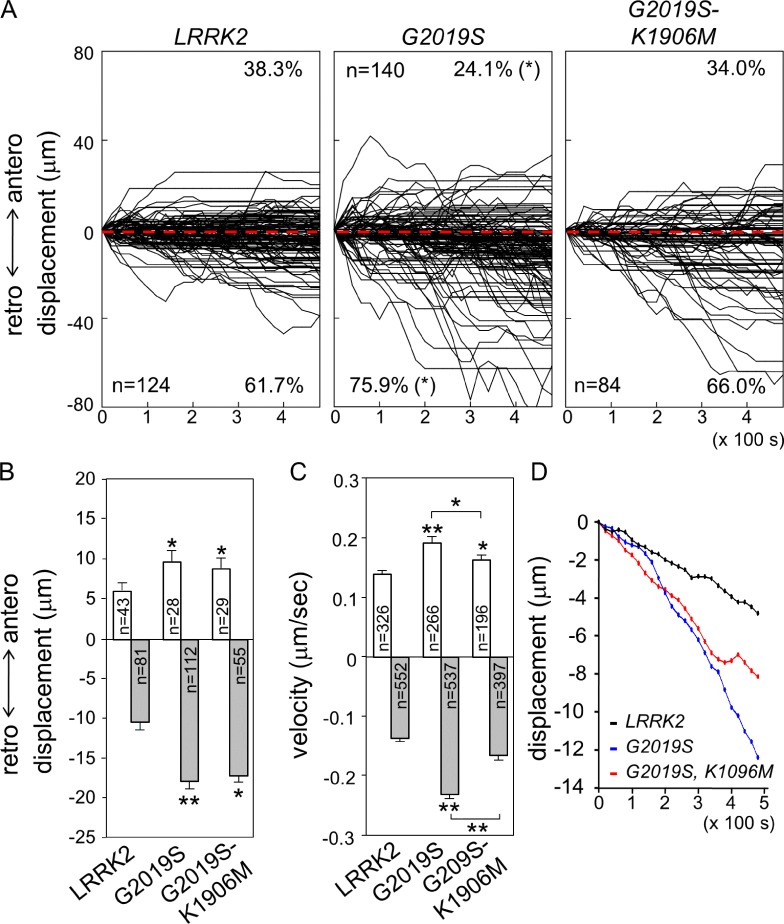
Figure 8.
Impacts of human LRRK2 proteins on GOP dynamics. (A) Combined tracks of ManII-GFP puncta are shown for ppk-GAL4 overexpression of LRRK2, G2019S, and G2019S-K1906M. (B and C) Bar graphs show anterograde and retrograde displacements in 8 min (B) and mean anterograde and retrograde velocities. Error bars represent SEM. Statistical comparisons are to controls (unless specifically indicated) by Student’s t test. *, P < 0.05; **, P < 0.001; n.s., no significance. (D) Mean paths of ManII-GFP puncta in these three overexpressions.

