
Figure 2.
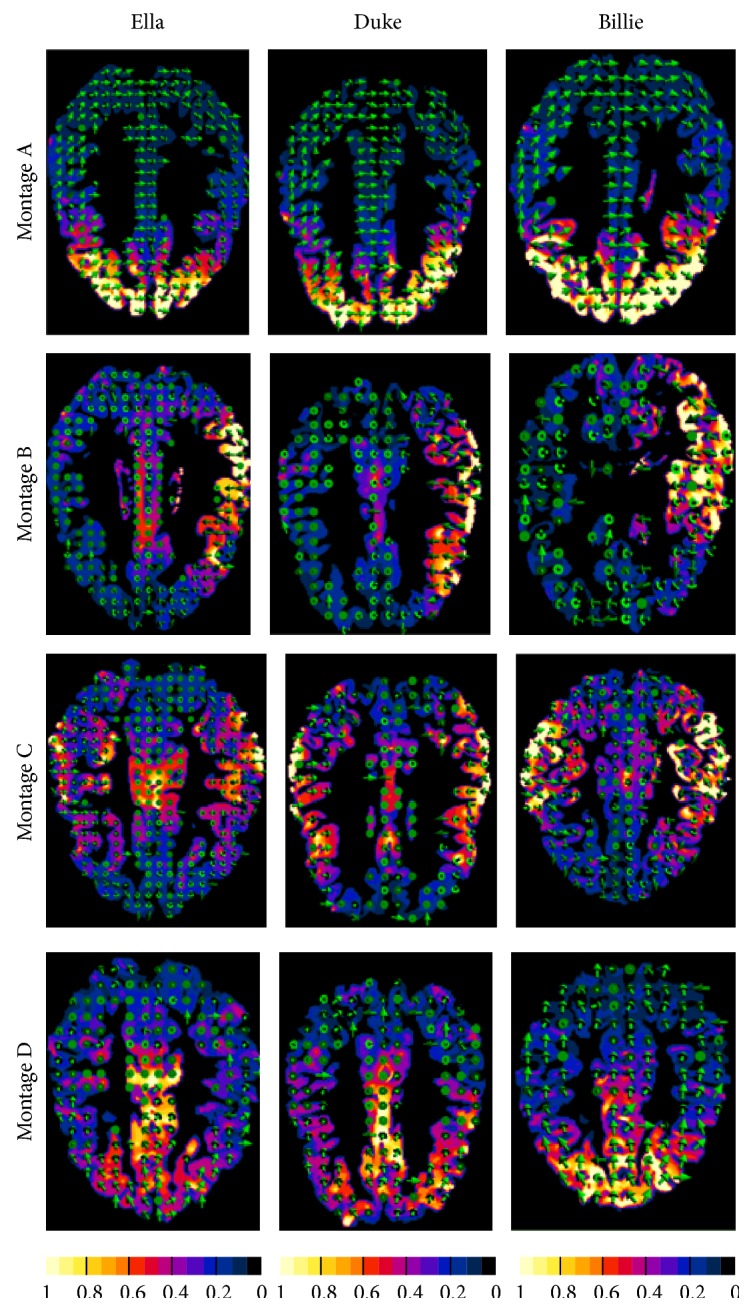
Transversal sections across the gray matter of E (or J) distribution for all the models for the electrode for Montages A–D. The other tissues and brain regions have been masked on the images. Colour map represents the amplitude of E, while the green arrows represent the direction of E. The amplitude values are normalized with respect to the peak of the E (or J) amplitude in the grey matter. Note that those panels can be compared only in terms of spatial distribution but not in terms of amplitude.