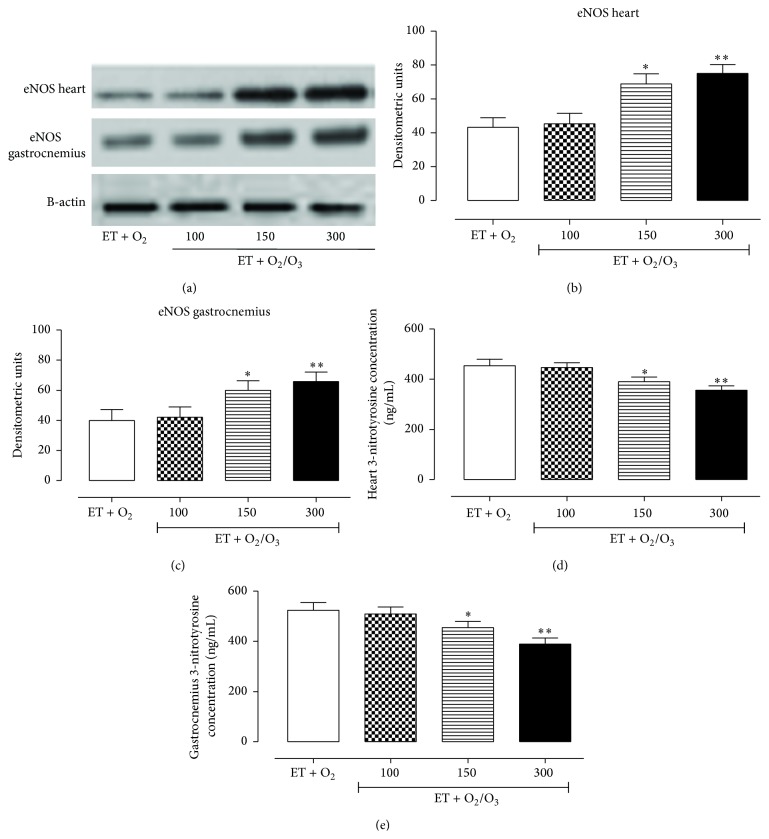
Figure 6.
Western blotting analysis of eNOS expression levels and determination of peroxynitrite production in cardiac and gastrocnemius tissues. (a) shows the expression levels of eNOS and β-actin (used as control) in heart and gastrocnemius of trained rats insufflated with oxygen (ET + O2) and with oxygen/ozone mixture at three different doses (100, 150, and 300 μg/kg). The expression levels of eNOS in heart (b) and gastrocnemius (c) are reported as densitometric units (y-axis). (d) and (e) show the 3-nitrotyrosine concentration (ng/mL) (y-axis) in all the experimental groups analyzed by ELISA test. At the dose of 150 μg/kg and more effectively at the dose of 300 μg/kg, ozone treatment significantly increased the expression level of eNOS and reduced 3-nitrotyrosine concentration both in cardiac and gastrocnemius tissues. Significant differences with respect to ET + O2 are shown as ∗ p < 0.05 and ∗∗ p < 0.01. ET = exercise trained rats running on treadmill.

