
Fig. 3.
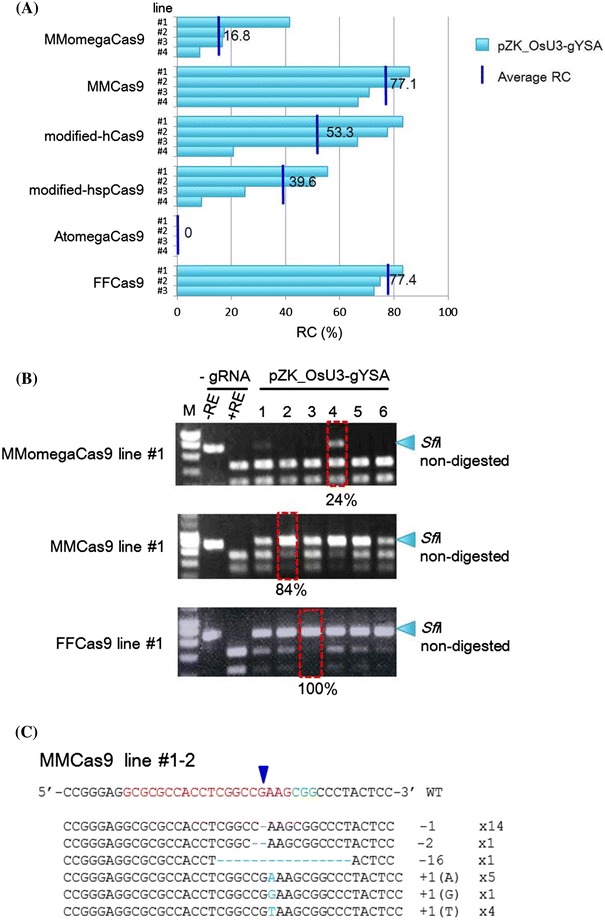
Comparison of Cas9 expression constructs. a Ratio of calli with mutations (RC) in different Cas9 expression constructs. DNAs extracted from pZH_Cas9 and pZK_OsU3-gYSA transformed calli were subjected to PCR and subsequent SfiI restriction enzyme digestion. Blue bars show the average RC in independent Cas9 transgenic lines, #1–#4 (or #3). b CAPS analysis of the gYSA locus in MMomegaCas9, MMCas9 and FFCas9 line #1. M Marker; −RE PCR product without restriction enzyme reaction; +RE SfiI-digested PCR product; -gRNA pZH_Cas9 transformed calli without pZK_OsU3-gYSA transformation; the HMF score was calculated from the PCR products indicated within red rectangles. c Mutations detected by sequence analysis of DNA extracted from MMCas9 #1–2 calli. The wild type sequence is shown at the top with the PAM sequence in green, and the 20 nt target sequence in red. The blue arrowhead indicates the expected cleavage site. Dashes deleted bases. The net changes in length are shown to the right of each sequence (+ insertion; − deletion). The number of clones representing each mutant allele is shown in brackets