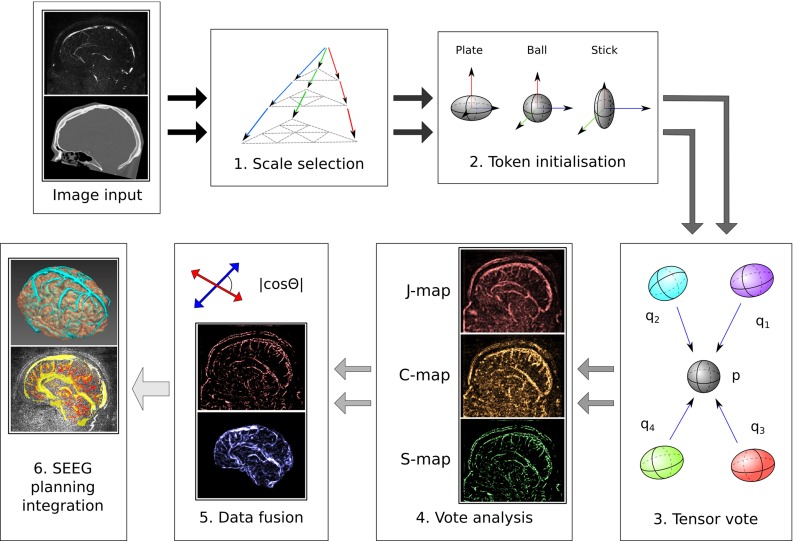
Fig. 1.

Vessel extraction diagram. After optimal scale selection, images are converted into tokens through analysis of the Hessian matrix. After voting, the resulting saliency maps are combined using the cosine between the vectors defining orientation. The resulting probability map is then visualised in the planning system
