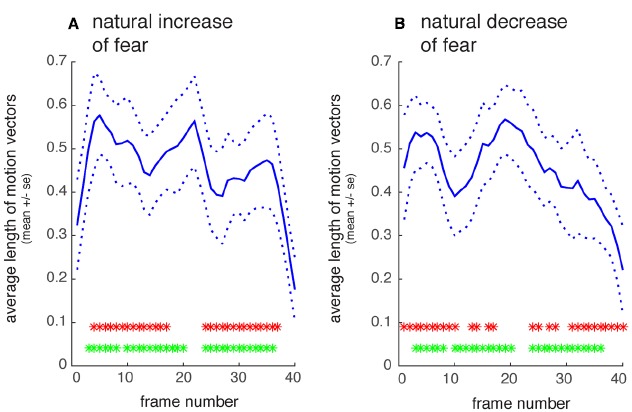
FIGURE 2.

Quantification of motion intensity over time. (A) Natural recordings of increasing fear, averaged across 11 actors. (B) Natural recordings of decreasing fear. The solid line shows the normalized average length of local motion vectors that were estimated for each frame-pair; dotted line: SE The upper row of asterisks shows time-points where the natural and reversed timelines differ significantly (p < 0.05, Bonferroni-corrected for 40 frames) in motion intensity. The lower row of asterisks shows timepoints where increasing fear movies differ in motion from reversed decreasing fear movies (same correction as above). X-axis denotes time in movie-frames (1/60s), y-axis normalized motion intensity.
