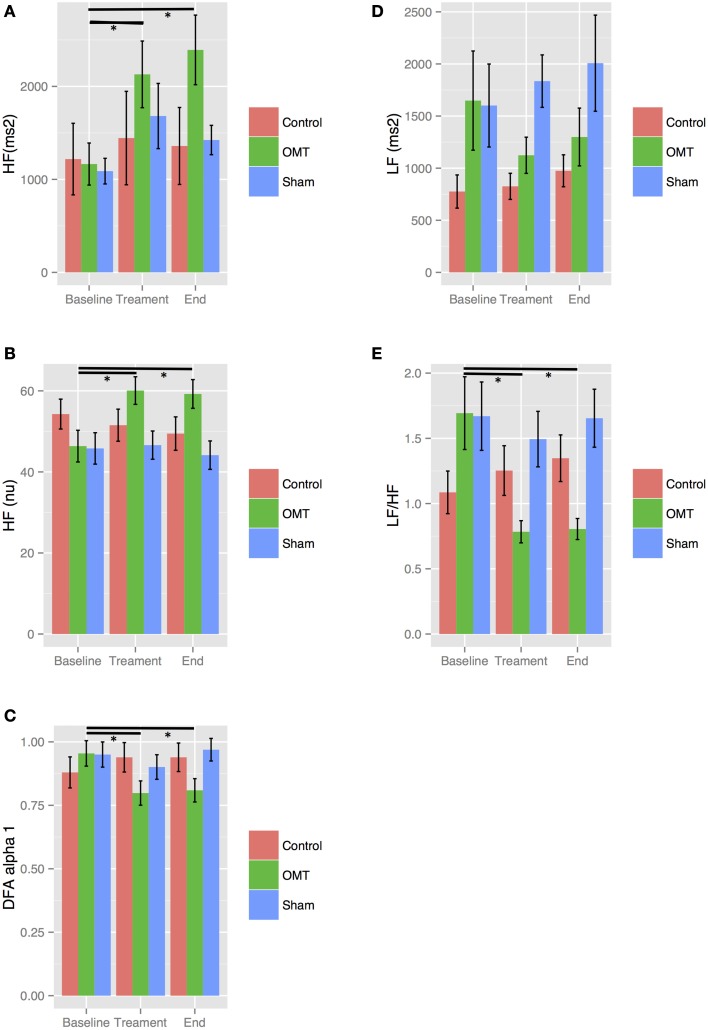
Figure 4.
Sensitivity analysis stratified by non-smoking. Numbers are mean ± SEM. HF(au) (A), high frequency absolute units; HF(nu) (B), high frequency normalized unit; DFAα1 (C), detrended fluctuation scaling exponent; LF (D), low frequency; LF/HF (E), low frequency/high frequency ratio. Each figure shows HRV data recorded during the three steps of the each session: baseline (5 min), treatment (15 min), end (5 min). *p < 0.001 from regression mixed effect model.

