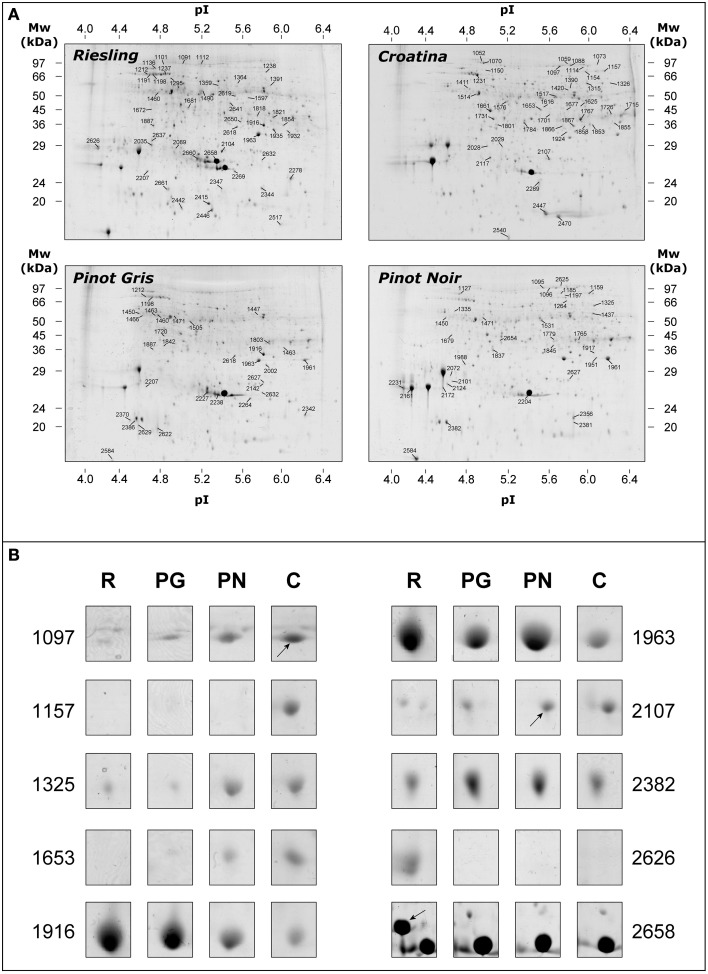
Figure 2.
Representative 2-DE maps of total protein fraction from grape berry exocarp of Riesling Italico, Pinot Gris, Pinot Noir, and Croatina. (A) whole maps of the four experimental cultivars. (B) the image of 10 spots that resulted to be significantly different in abundance among the cultivars. Proteins (500 μg) were separated at pH 4–7, followed by 12.5% SDS-PAGE and visualized by cCBB-staining.

