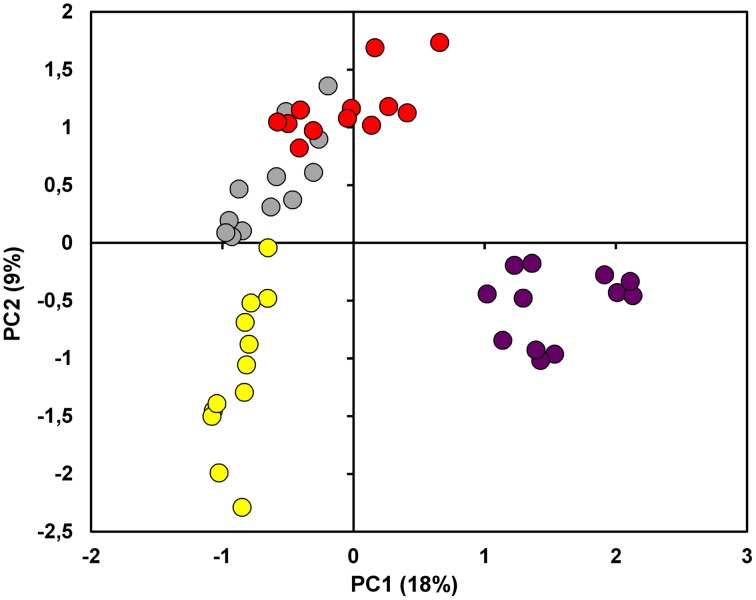
Figure 3.
Principal Component Analysis (PCA). The score plot showed in the figure was performed on the overall dataset considering the first two PCs. The samples under investigation are coded by a twelve-circle symbol colored in yellow, gray, red and violet for Riesling Italico, Pinot Gris, Pinot noir, and Croatina, respectively.

