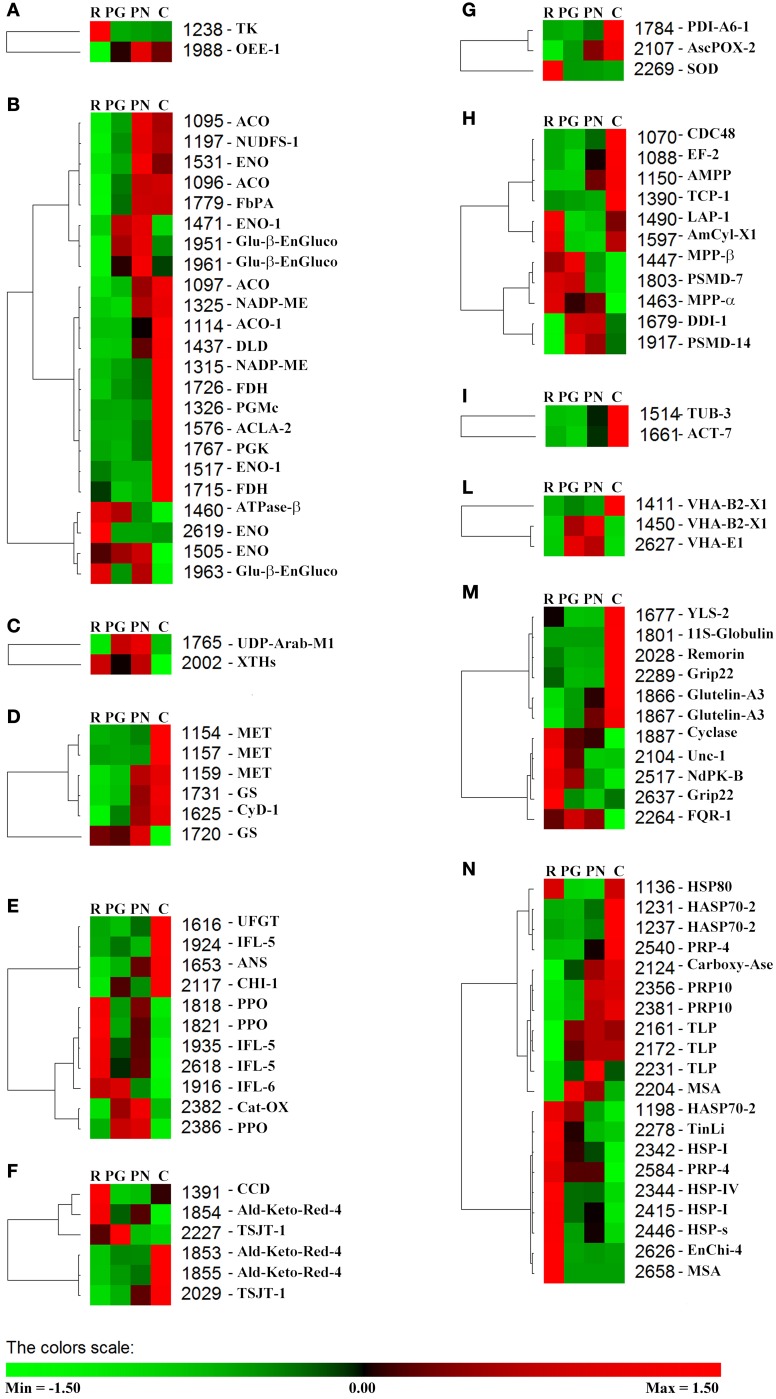
Figure 5.
Clustering analysis of the spots grouped according to their functional class. Two-way hierarchical clustering analysis of proteins that resulted to be significantly different in their relative spot volumes and identified by LC-ESI-MS/MS (Table 3) was performed with PermutMatrix. Pearson's distance and Ward's algorithm were used for the analysis. Each colored cell represents the average of the relative spot value, according to the color scale at the bottom of the figure. (A) Phothosynthesis. (B) C-compound/carbohydrate/energy metabolism. (C) Cell wall. (D) Nitrogen metabolism and amino acid metabolism. (E) Secondary metabolism. (F) Hormone metabolism. (G) Redox. (H) Protein. (I) Cell organization/Signal. (L) Transport. (M) Other functions. (N) Stress.

