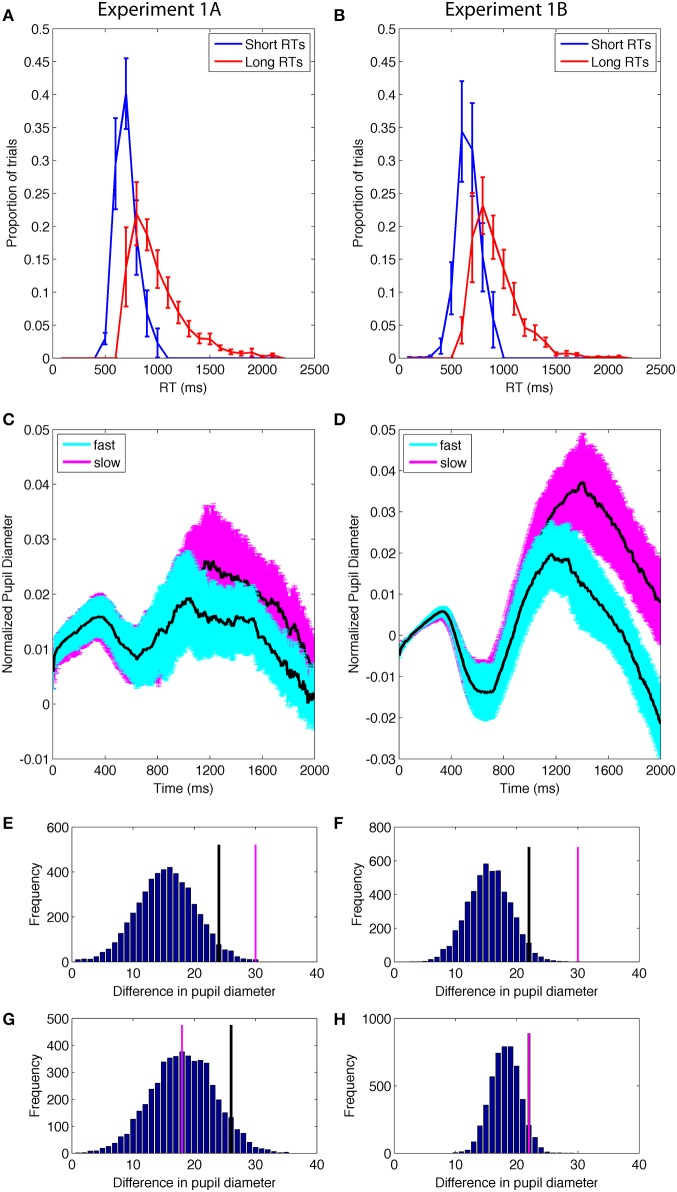
Figure 5.
(A,B) Distribution of short and long RTs determined by a median split of data from correct trials within each individual. (C,D) Pupil diameter as a function of the RT median split. Error bands are standard error of the mean. (E,F) Permutation results on the difference between pupil diameter on trials with shorter and longer RTs during the cognitive period; the difference had a <1% probability of occurring due to chance. Black lines identify the top 5% of the permutation results; pink lines are the actual data. (G,H) Permutation results on the difference in pupil diameter as a function of RT from the control time period; the results had a >5% probability of occurring due to chance, suggesting that difference was not reliable.

