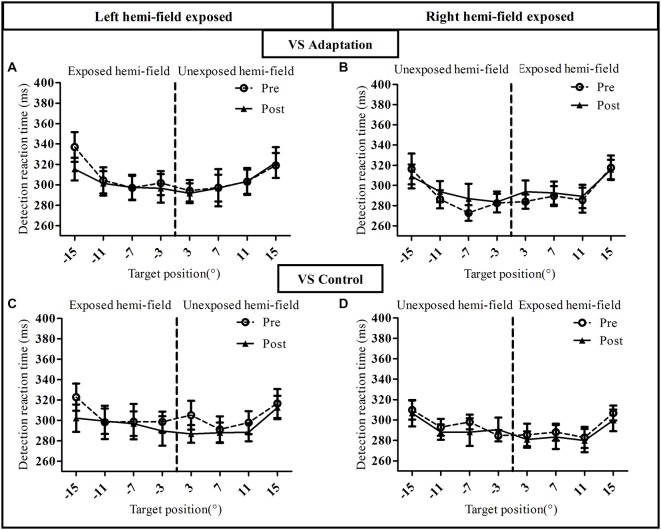
Figure 6.
Visual detection performance in the voluntary saccade condition of Experiment I. Mean manual reaction time is plotted as a function of target position for the pre-exposure phase (open circles, dotted line) and post-exposure phase (filled triangles, solid line). Upper row: adaptation groups (A: Adapt-Left group, B: Adapt-Right group), lower row: control groups (C: Control-left group, D: Control-right group).

